Fig. 8
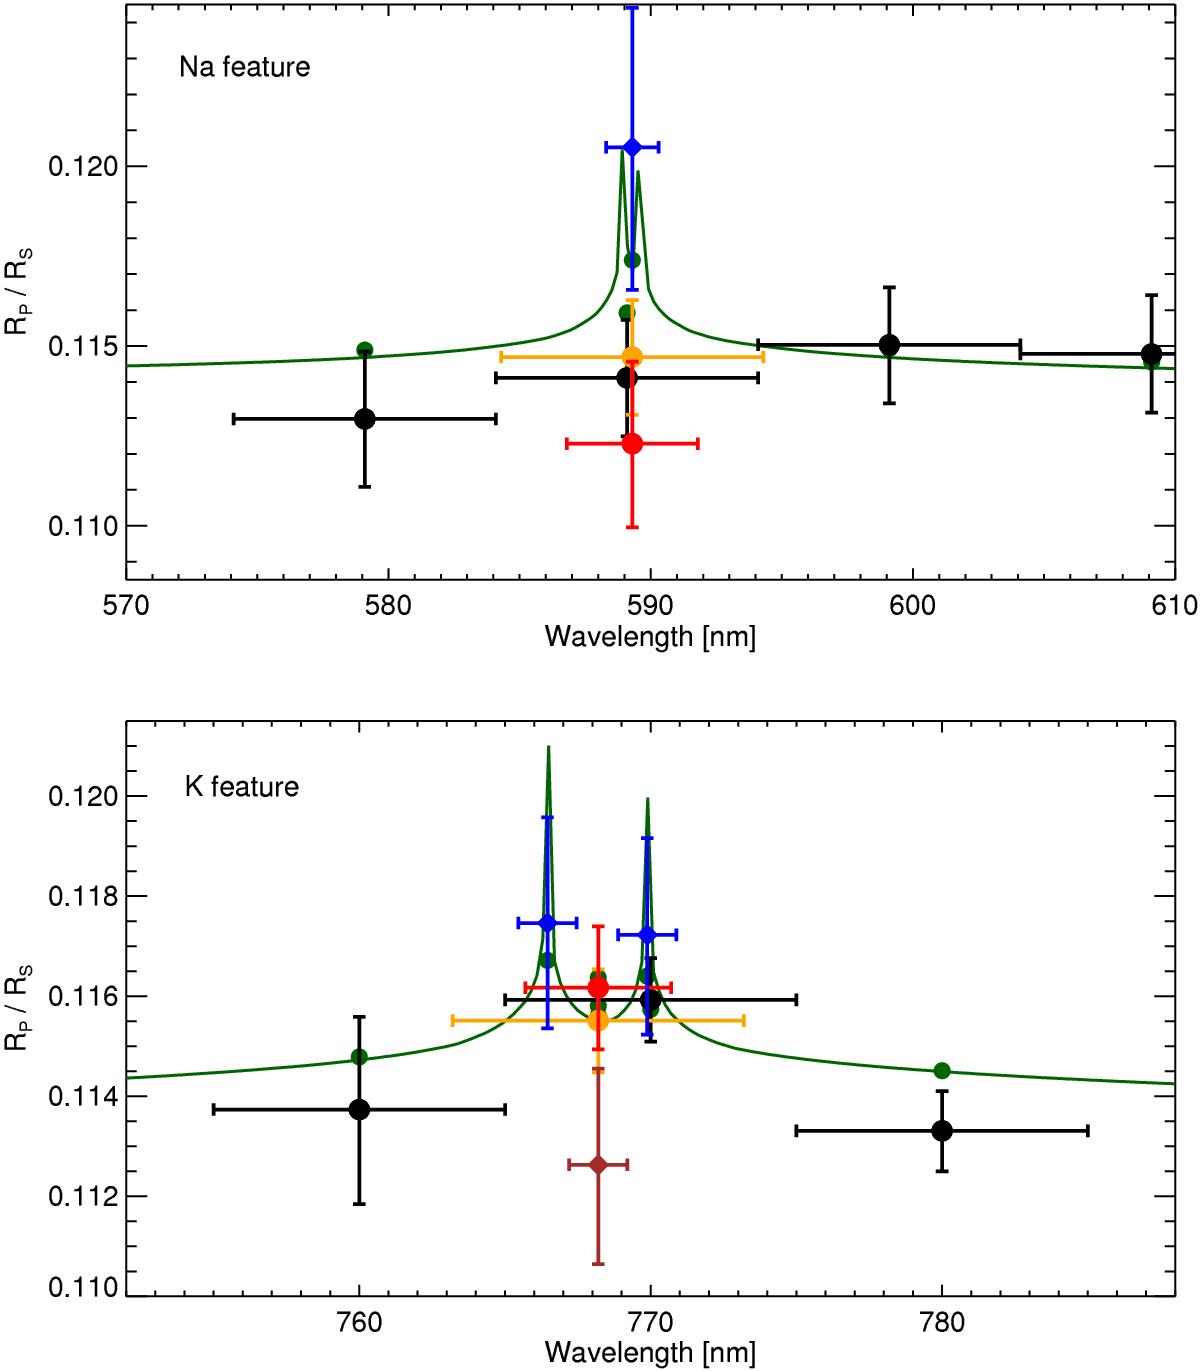
Transmission spectrum of WASP-103b zoomed in on the Na (top) and K (bottom) features. The black points refer to the 10 nm wavelength bins also shown in Fig. 6, blue points indicate 2 nm bins centered on the features: either one bin centered on the Na feature, or two point centered on each component of the K feature. In the lower panel, brown refers to a 2 nm wide bin centered between the two components. Red and orange points denote wavelength bins of 5 and 10 nm width, respectively, centered on the features. The solar-composition model spectrum is shown in green, and filled circles indicate the model binned to the resolution of the data.
Current usage metrics show cumulative count of Article Views (full-text article views including HTML views, PDF and ePub downloads, according to the available data) and Abstracts Views on Vision4Press platform.
Data correspond to usage on the plateform after 2015. The current usage metrics is available 48-96 hours after online publication and is updated daily on week days.
Initial download of the metrics may take a while.