Fig. 7
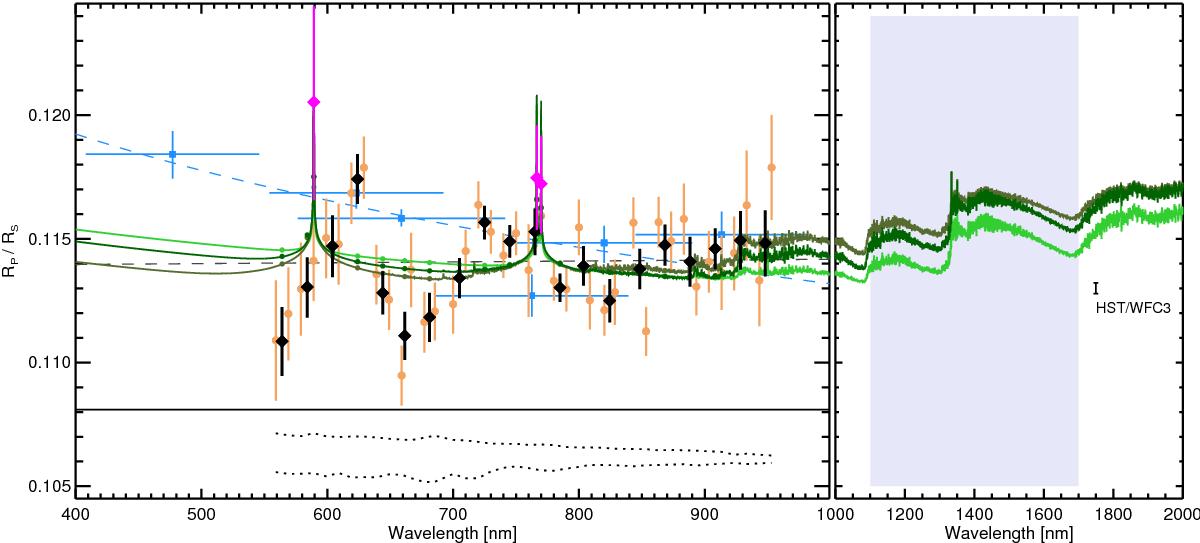
Optical transmission spectrum of WASP-103b. Measurements obtained with 10 and 20 nm wide bins are shown as brown filled circles and black squares, respectively. Measurements in 2 nm wide bins centered on the Na feature, as well as on both components of the K feature are shown in magenta. Observations by Southworth & Evans (2016) are indicated by blue squares, together with their inferred spectral sloped (blue dashed line). The best-fit spectral slope inferred from our data is shown as a gray dashed line. Model transmision spectra for WASP-103b’s are shown as a light green (0.1 × solar metallicity), dark green (solar metallicity) and olive (10 × solar metallicity) lines and filled circles indicate the models binned to the resolution of the data. Below, the two dotted lines indicate the possible added spectral slopes (at 3-σ level) due to uncertainties in the properties of WASP-103b and the contaminating star. The vertical scale is identical to that of the upper panel. In the right panel, the shaded region indicates the wavelength coverage of HST/WFC3’s G141 grism, and the expected precision of spectrophotometric WFC3 measurements is indicated.
Current usage metrics show cumulative count of Article Views (full-text article views including HTML views, PDF and ePub downloads, according to the available data) and Abstracts Views on Vision4Press platform.
Data correspond to usage on the plateform after 2015. The current usage metrics is available 48-96 hours after online publication and is updated daily on week days.
Initial download of the metrics may take a while.