Free Access
Fig. 4
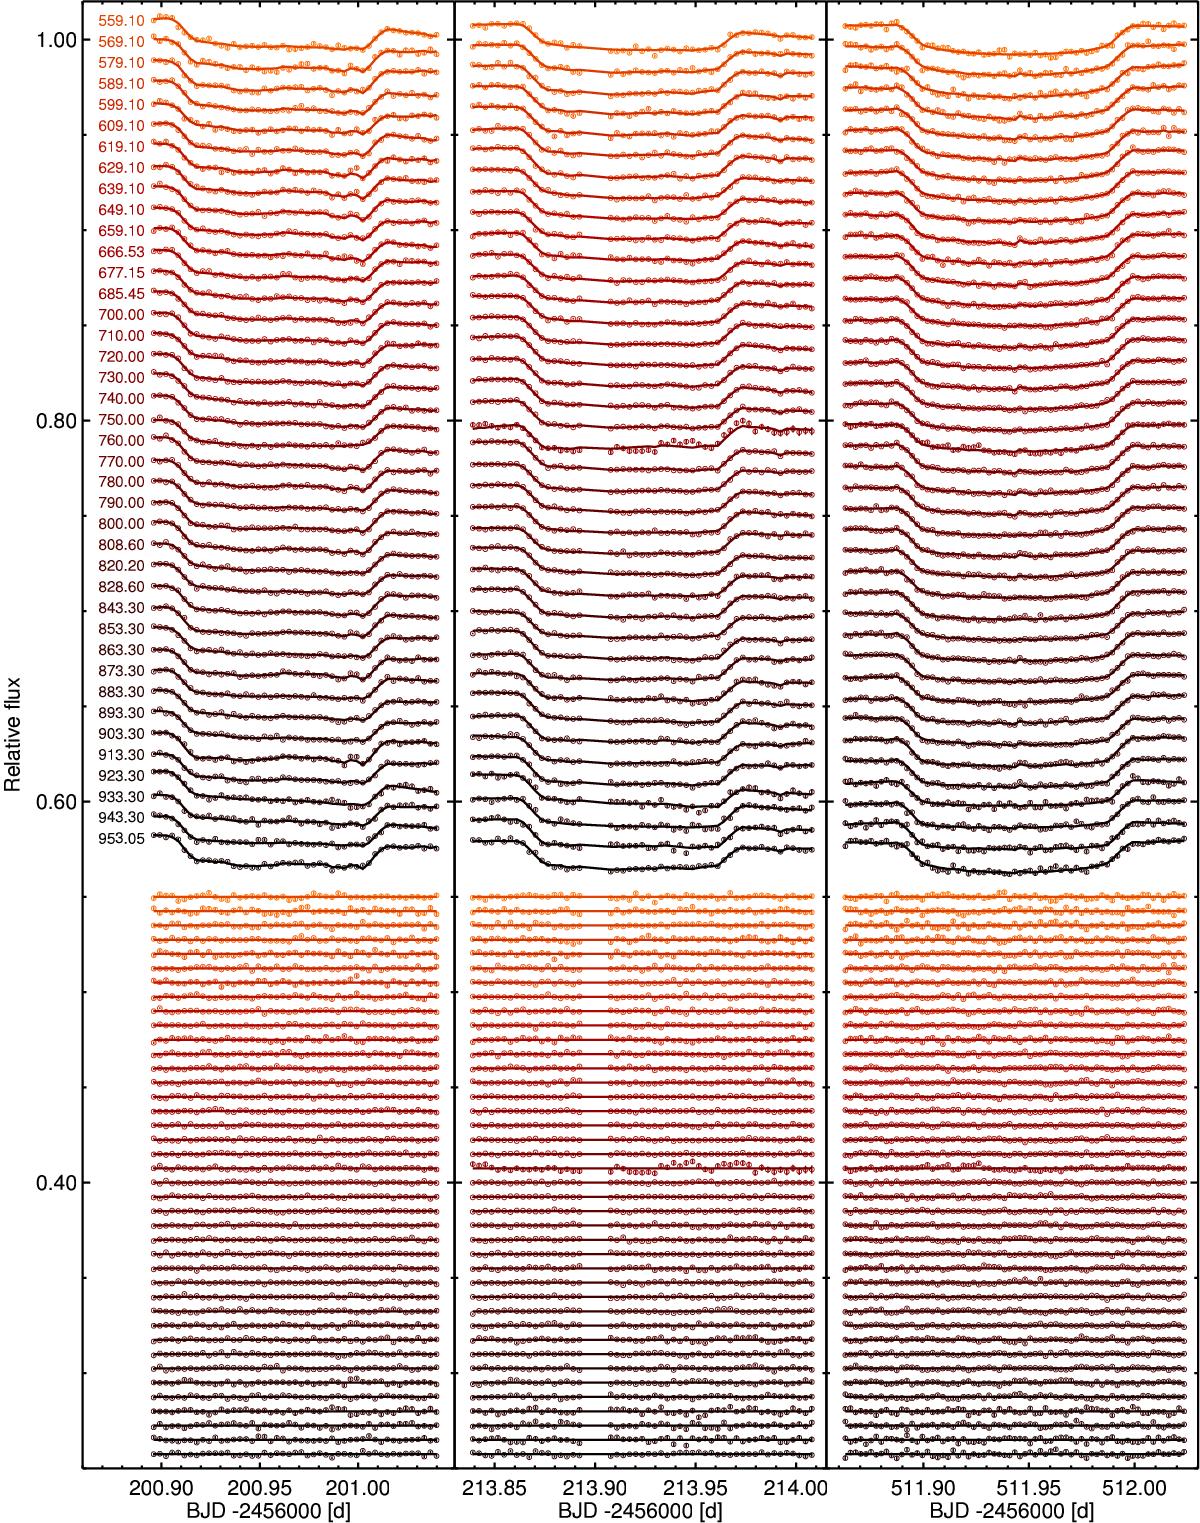
Spectrophotometric light curves of the three observation epochs (left, center, and right panels) obtained using 10 nm bins. The central wavelength of each bin (in nm) is indicated in the left panel. Residuals are shown below, in the same order as the light curves.
Current usage metrics show cumulative count of Article Views (full-text article views including HTML views, PDF and ePub downloads, according to the available data) and Abstracts Views on Vision4Press platform.
Data correspond to usage on the plateform after 2015. The current usage metrics is available 48-96 hours after online publication and is updated daily on week days.
Initial download of the metrics may take a while.