Fig. 2
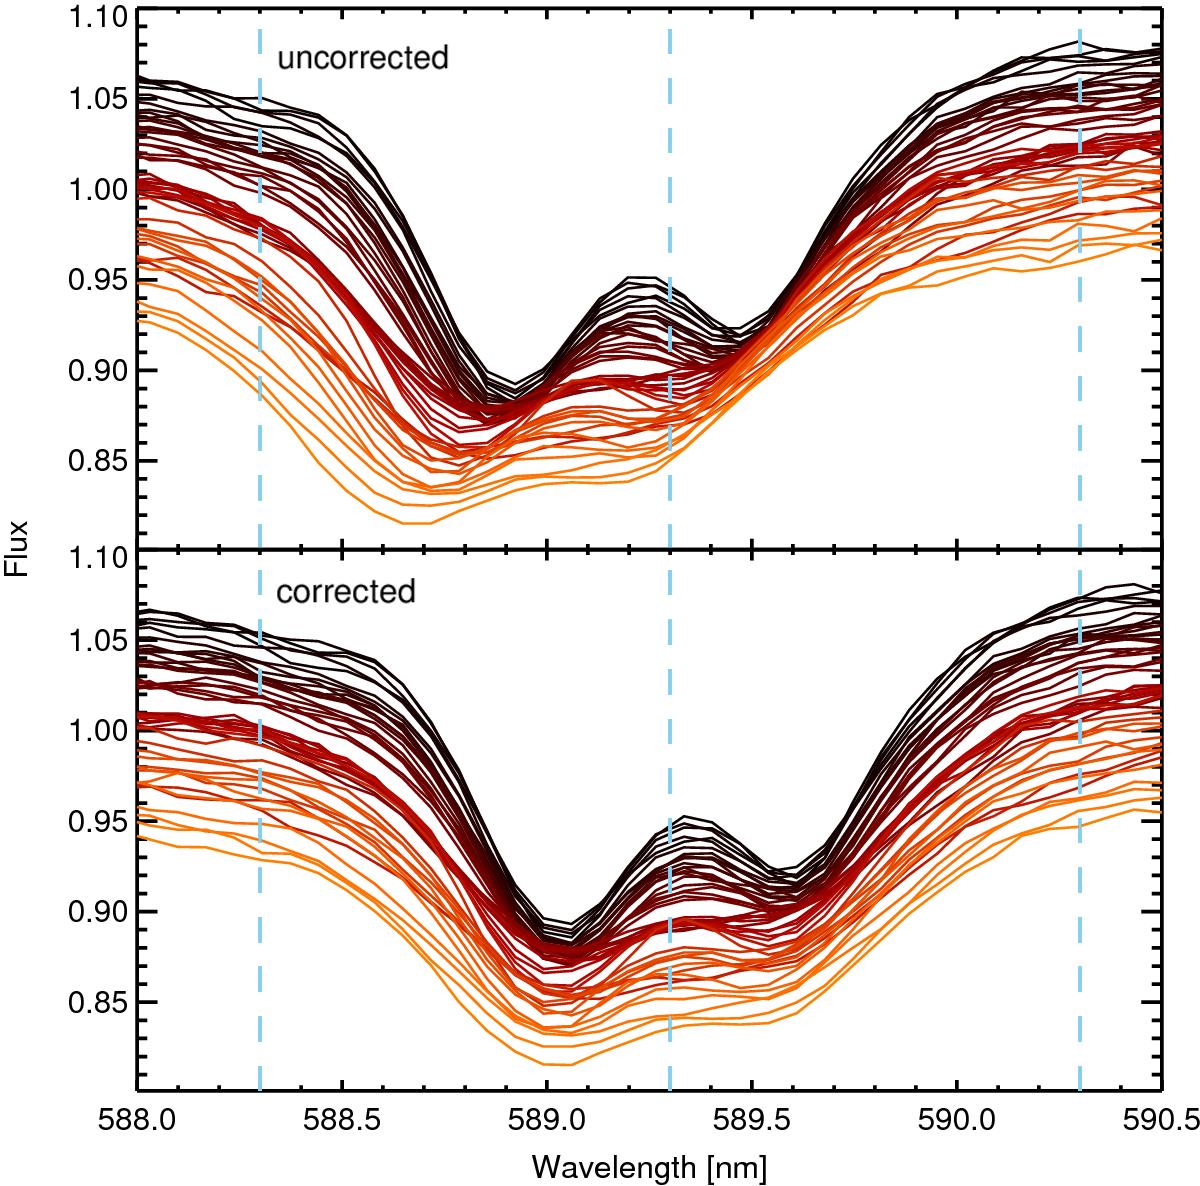
Enlargement of the Na feature at 589 nm showing all spectra obtained on 07 June 2015. Flux is given in arbitrary units, and the spectra are color-coded and shifted on the y-axis for illustrative purposes. The top panel shows the drift of the wavelength solution throughout the sequence before wavelength recalibration, and the bottom panel shows the same sequence of spectra after recalibration. Vertical blue dashed lines indicate the center and limits of our smallest wavelength bin around the Na feature.
Current usage metrics show cumulative count of Article Views (full-text article views including HTML views, PDF and ePub downloads, according to the available data) and Abstracts Views on Vision4Press platform.
Data correspond to usage on the plateform after 2015. The current usage metrics is available 48-96 hours after online publication and is updated daily on week days.
Initial download of the metrics may take a while.