Free Access
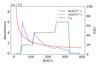
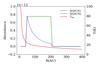
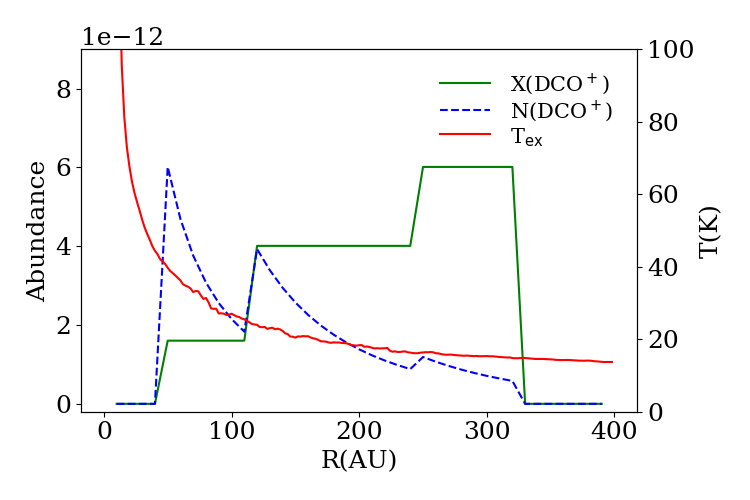
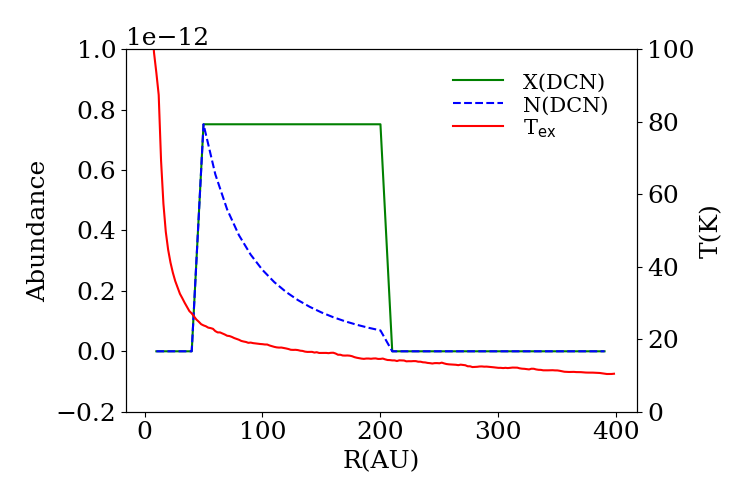
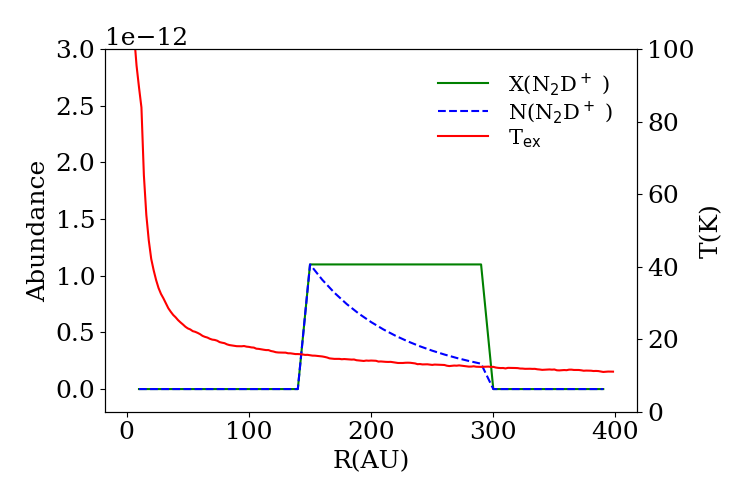
Fig. 5
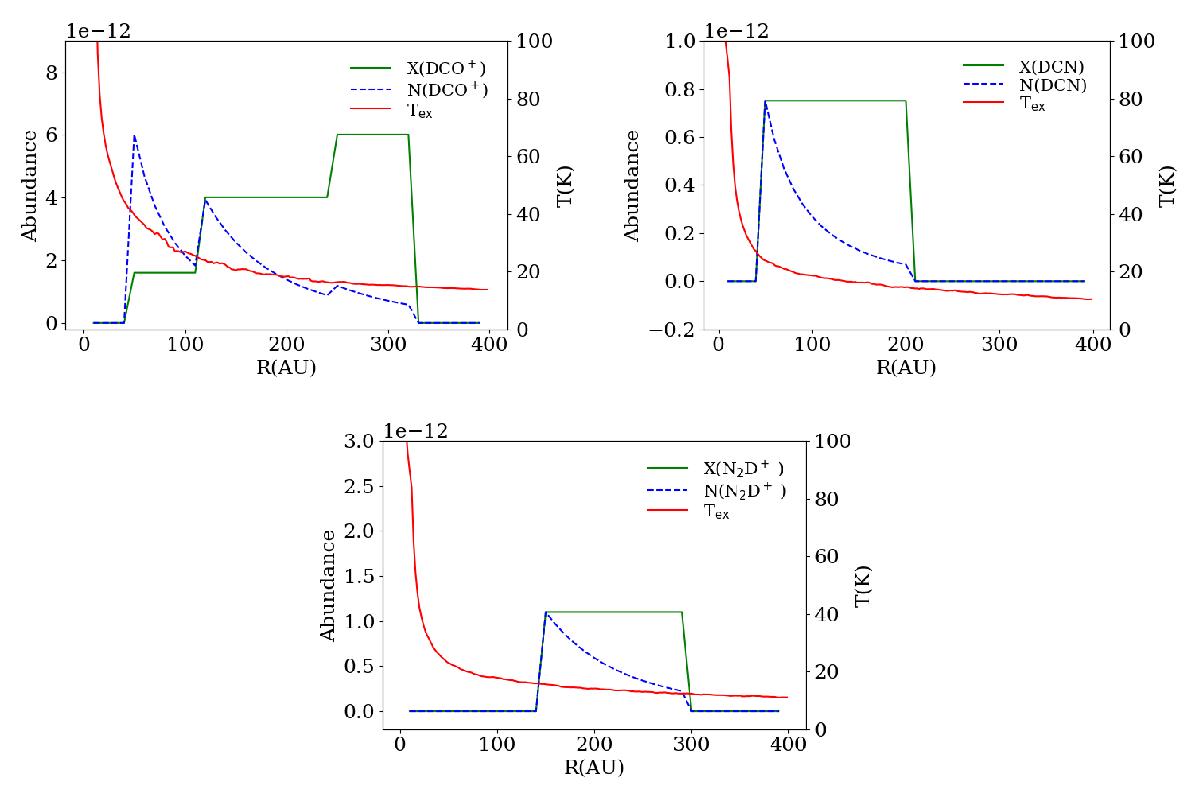
Schematics of the abundance models for the transitions of DCO+J = 3 − 2, DCN J = 3 − 2 and N2D+J = 3 − 2. The dashed blue line corresponds to a scaled profile of the column density of the abundance model for the purpose of illustration. The red continuous line corresponds to the assumed excitation temperature profile.
This figure is made of several images, please see below:
Current usage metrics show cumulative count of Article Views (full-text article views including HTML views, PDF and ePub downloads, according to the available data) and Abstracts Views on Vision4Press platform.
Data correspond to usage on the plateform after 2015. The current usage metrics is available 48-96 hours after online publication and is updated daily on week days.
Initial download of the metrics may take a while.