Free Access
Fig. 4
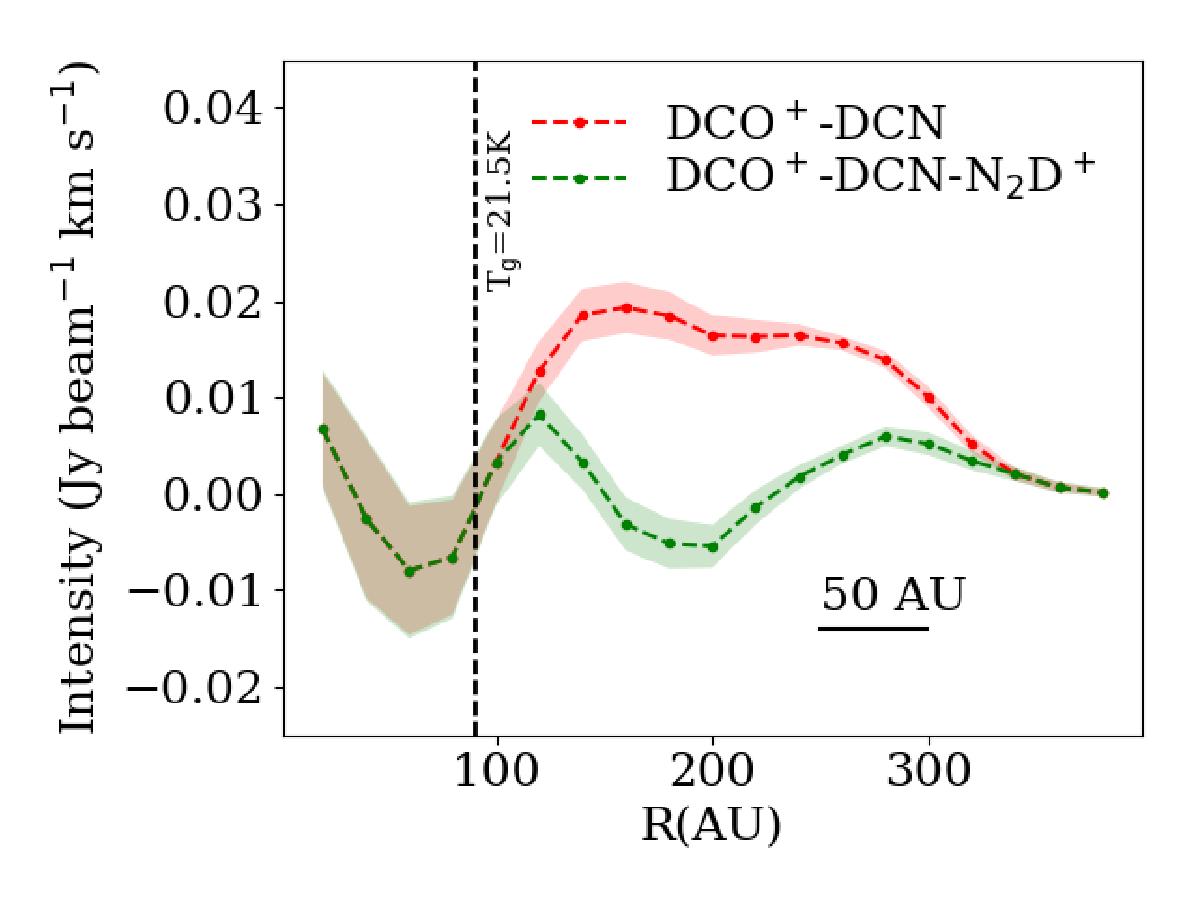
Residuals of the DCO+ radial profile (as shown in Fig. 3) by subtracting first the DCN radial profile and then the N2D+ radial profile. The shadowed color area represents 1σ errors, where σ is the standard deviation in one elliptical annulus. The black dashed line corresponds to the location of the CO snowline (90 AU).
Current usage metrics show cumulative count of Article Views (full-text article views including HTML views, PDF and ePub downloads, according to the available data) and Abstracts Views on Vision4Press platform.
Data correspond to usage on the plateform after 2015. The current usage metrics is available 48-96 hours after online publication and is updated daily on week days.
Initial download of the metrics may take a while.