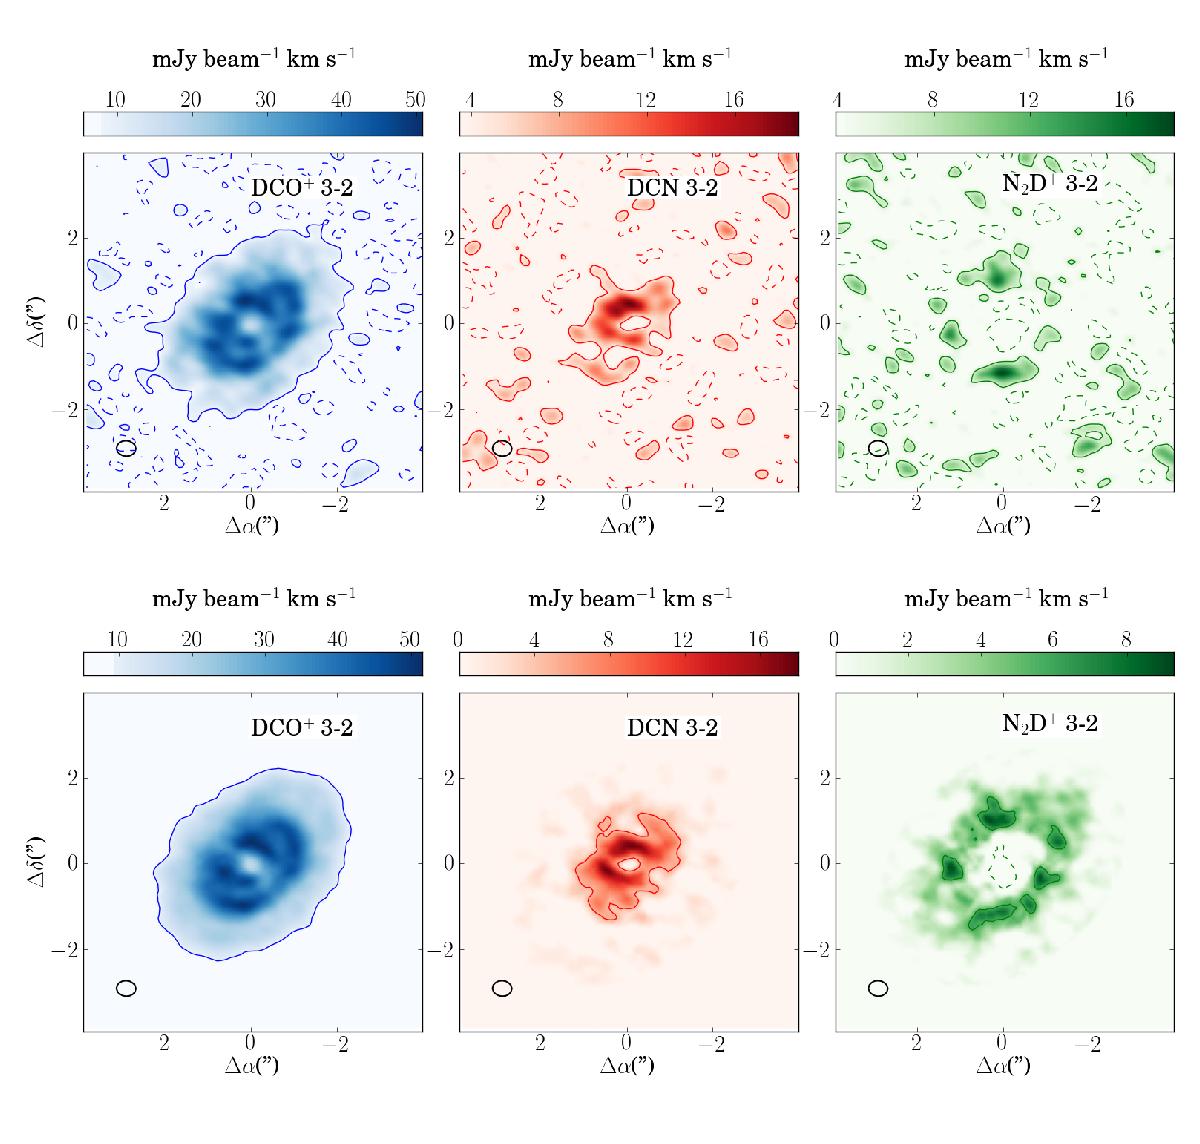
Fig. 1

Integrated intensity maps of DCO+, N2D+, and DCN with (lower panels) and without (upper panels) a Keplerian mask as explained in Appendix A. The resulting synthesized beams of ![]() for DCO+ and DCN, and
for DCO+ and DCN, and ![]() for N2D+ using natural weighting are shown at the lower left of each map. Contours are 1σ levels, where σ is estimated as the rms of an emission free region in the sky.
for N2D+ using natural weighting are shown at the lower left of each map. Contours are 1σ levels, where σ is estimated as the rms of an emission free region in the sky.
Current usage metrics show cumulative count of Article Views (full-text article views including HTML views, PDF and ePub downloads, according to the available data) and Abstracts Views on Vision4Press platform.
Data correspond to usage on the plateform after 2015. The current usage metrics is available 48-96 hours after online publication and is updated daily on week days.
Initial download of the metrics may take a while.


