Fig. 9
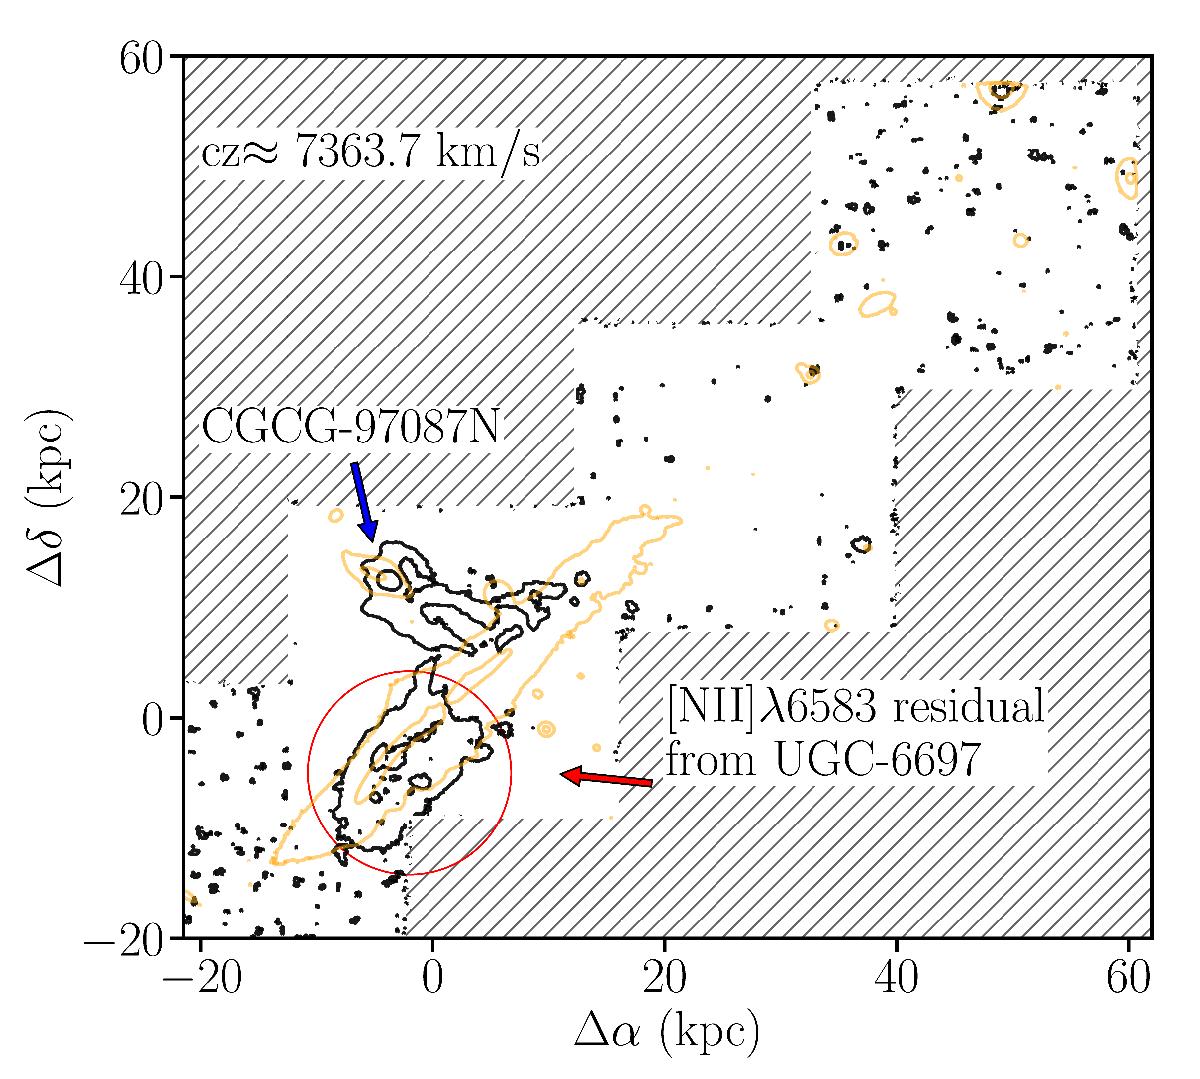
Contour of the Hα flux of the tails of UGC 6697 and CGCG 97087N after the [NII] emission has been isolated and subtracted. The red circle indicates the contours arising from the residual flux of the [NII]λ6583 emitted by UGC 6697. Regions not observed are shaded in gray. Yellow contours represent the 23th and the 20th magéarcsec-2 isophotes in the SDSS r-band image obtained from the datacube.
Current usage metrics show cumulative count of Article Views (full-text article views including HTML views, PDF and ePub downloads, according to the available data) and Abstracts Views on Vision4Press platform.
Data correspond to usage on the plateform after 2015. The current usage metrics is available 48-96 hours after online publication and is updated daily on week days.
Initial download of the metrics may take a while.