Free Access
Fig. 6
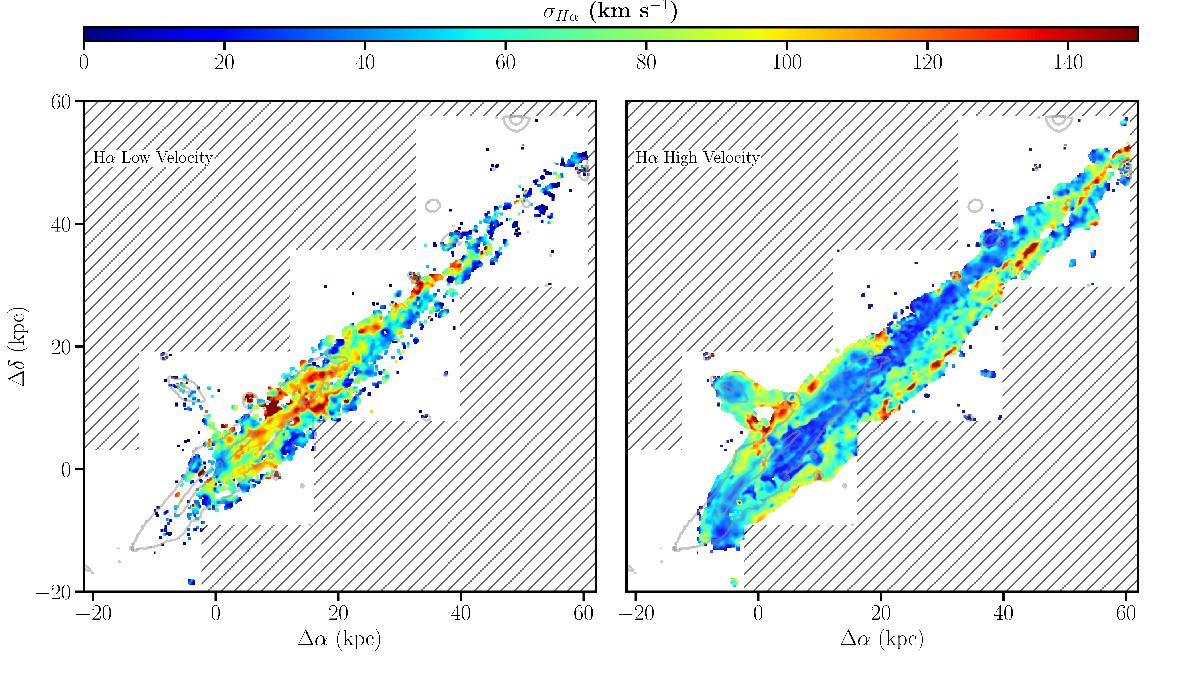
Velocity dispersion map derived from the Hα line, fit with a double velocity component. In the left panel we plot the low-velocity component and in the right panel the high-velocity component. Gray contours represent the 23th and the 20th mag arcsec-2 isophotes in the SDSS r-band image obtained from the datacube.
Current usage metrics show cumulative count of Article Views (full-text article views including HTML views, PDF and ePub downloads, according to the available data) and Abstracts Views on Vision4Press platform.
Data correspond to usage on the plateform after 2015. The current usage metrics is available 48-96 hours after online publication and is updated daily on week days.
Initial download of the metrics may take a while.