Free Access
Fig. 5
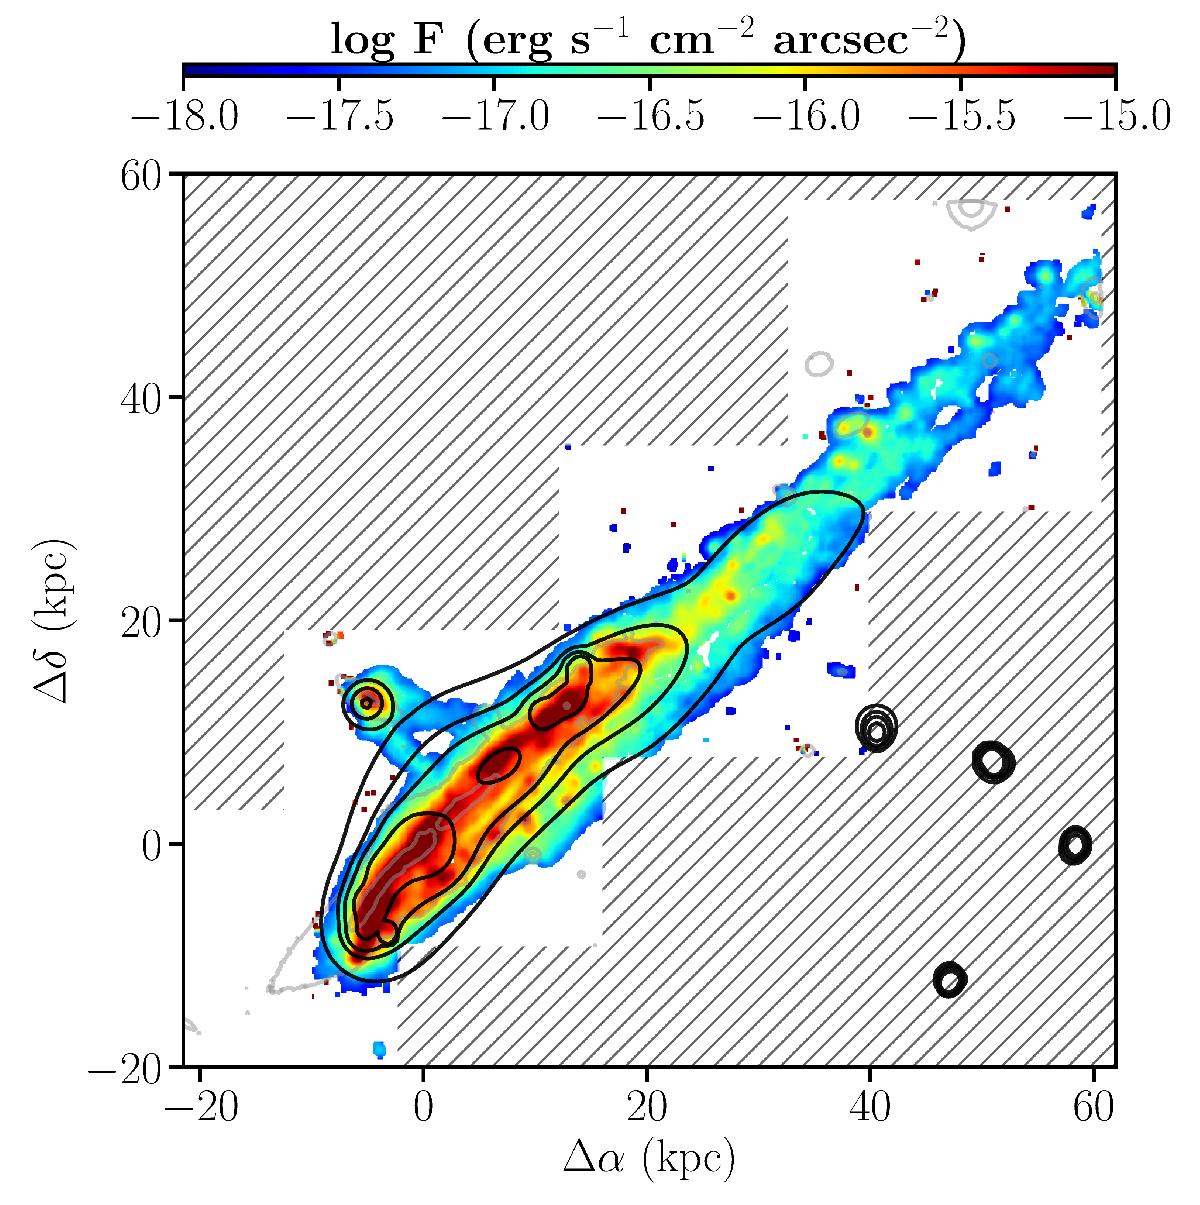
Total flux distribution of Hα emission with the Chandra contours superimposed to show the region of the X-ray emitting gas. The X-ray map has been smoothed, but the X-ray front is at the same position as the Hα front. The X-ray tail appears cospatial to the Hα tail.
Current usage metrics show cumulative count of Article Views (full-text article views including HTML views, PDF and ePub downloads, according to the available data) and Abstracts Views on Vision4Press platform.
Data correspond to usage on the plateform after 2015. The current usage metrics is available 48-96 hours after online publication and is updated daily on week days.
Initial download of the metrics may take a while.