Fig. 15
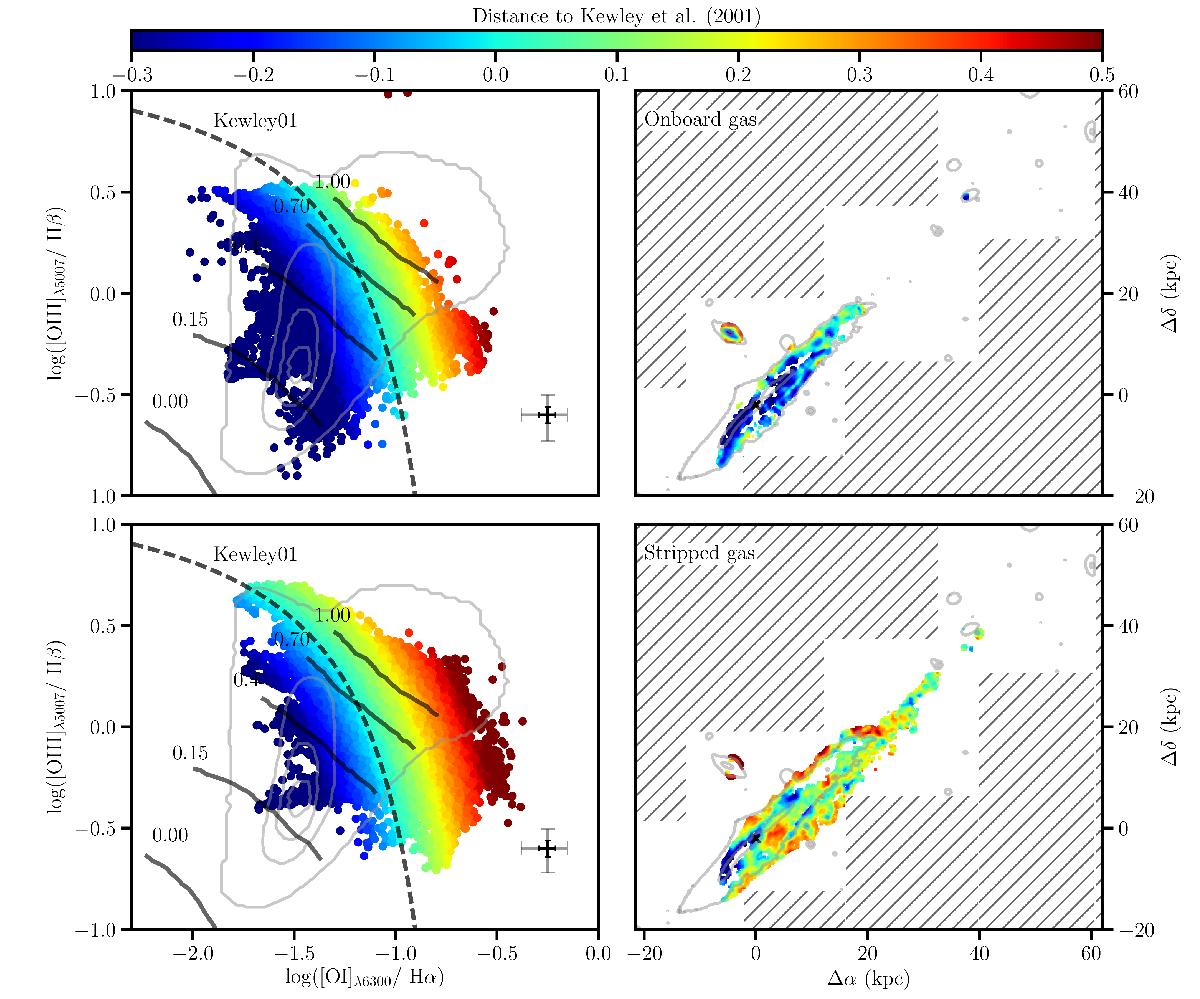
Top Left: BPT diagram of the onboard component of UGC 6697 using the [OI] to H α ratio. The dashed curve separates AGN from HII regions and is adopted from Kewley et al. (2001, kewley01). Data are color-coded according to their minimum distance to the Kewley01 curve. The black and gray crosses indicate the typical error of the ratio of lines with an S/N ≈ 15 and S/N ≈ 5, respectively. At higher S/N, the error becomes comparable to the dot size. Thick solid lines show the five different shock models by Rich et al. (2011), indicating that five different fractions (from 0 to 1) of Hα flux contributed by shocks. The gray contours are obtained from a random sample of nuclear spectra of SDSS galaxies in the redshift range 0.01−0.1 and with masses from 109 and 1011M⊙. Right: map of UGC 6697 of the spaxel contributing to the BPT of the onboard component, color-coded as in the left panel. The black cross indicates the center of the galaxy, while regions of the sky not mapped by the MUSE mosaic are shaded in gray. Bottom: same as in the top panels, but for the stripped component of the gas.
Current usage metrics show cumulative count of Article Views (full-text article views including HTML views, PDF and ePub downloads, according to the available data) and Abstracts Views on Vision4Press platform.
Data correspond to usage on the plateform after 2015. The current usage metrics is available 48-96 hours after online publication and is updated daily on week days.
Initial download of the metrics may take a while.