Free Access
Fig. 12
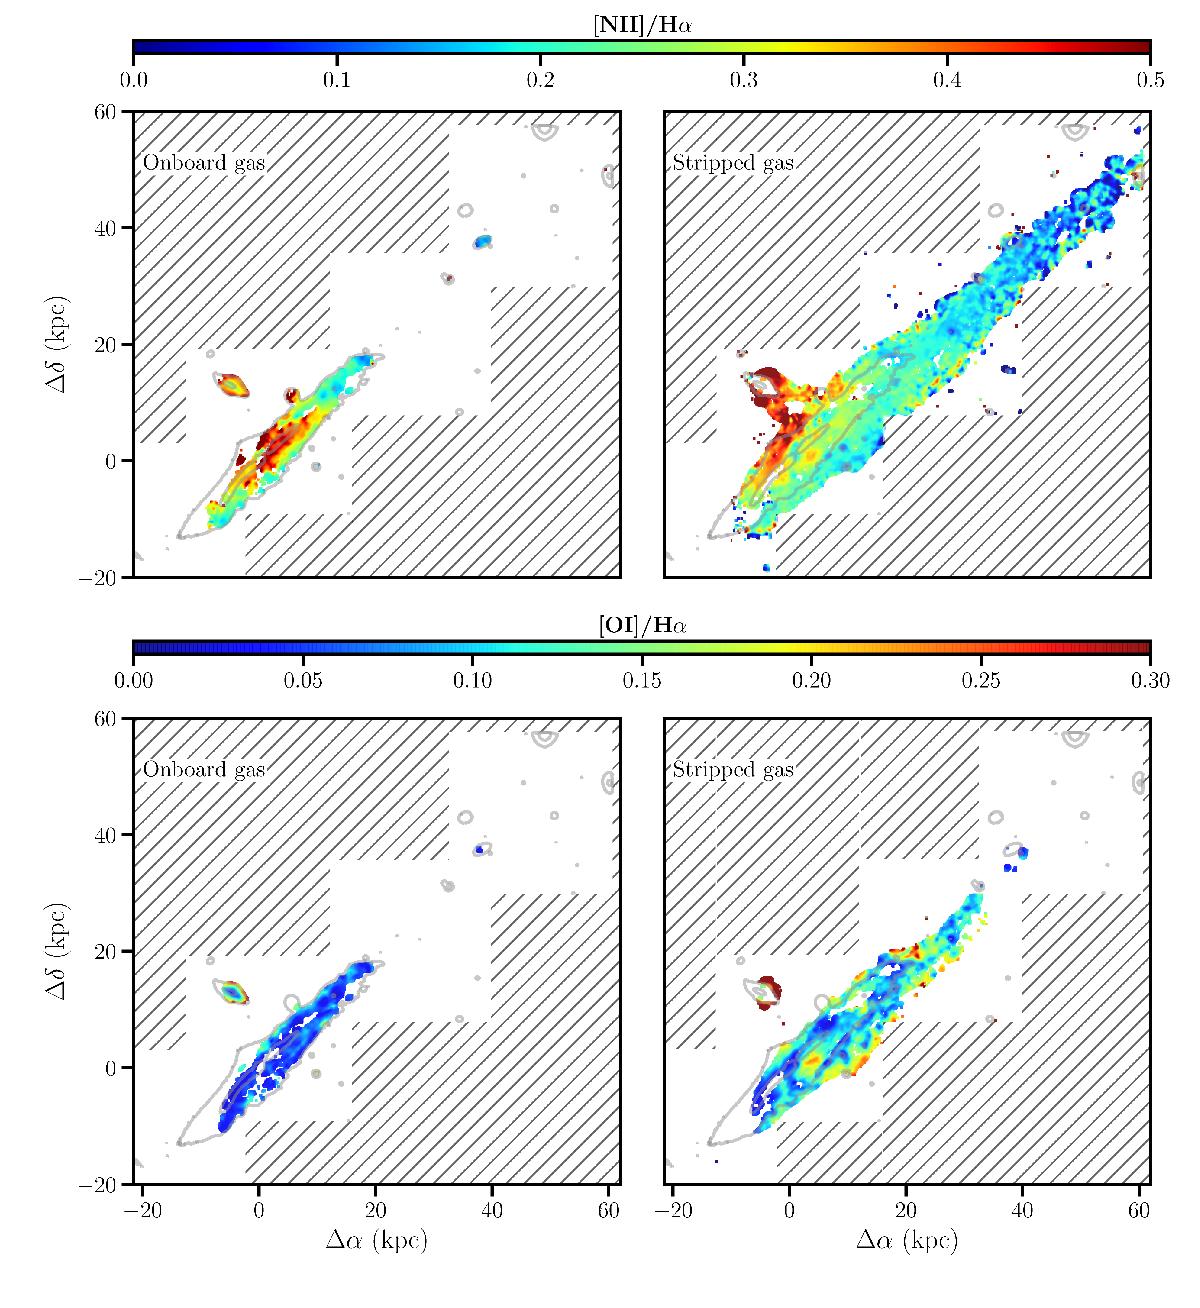
Maps of line ratios for the onboard (left) and stripped (right) components. From top to bottom, we plot the [NII]λ6584/Hα and [OI]λ6300/Hα maps, respectively. Contours and gray shaded areas are the same as in previous figures.
Current usage metrics show cumulative count of Article Views (full-text article views including HTML views, PDF and ePub downloads, according to the available data) and Abstracts Views on Vision4Press platform.
Data correspond to usage on the plateform after 2015. The current usage metrics is available 48-96 hours after online publication and is updated daily on week days.
Initial download of the metrics may take a while.