Free Access
Fig. 11
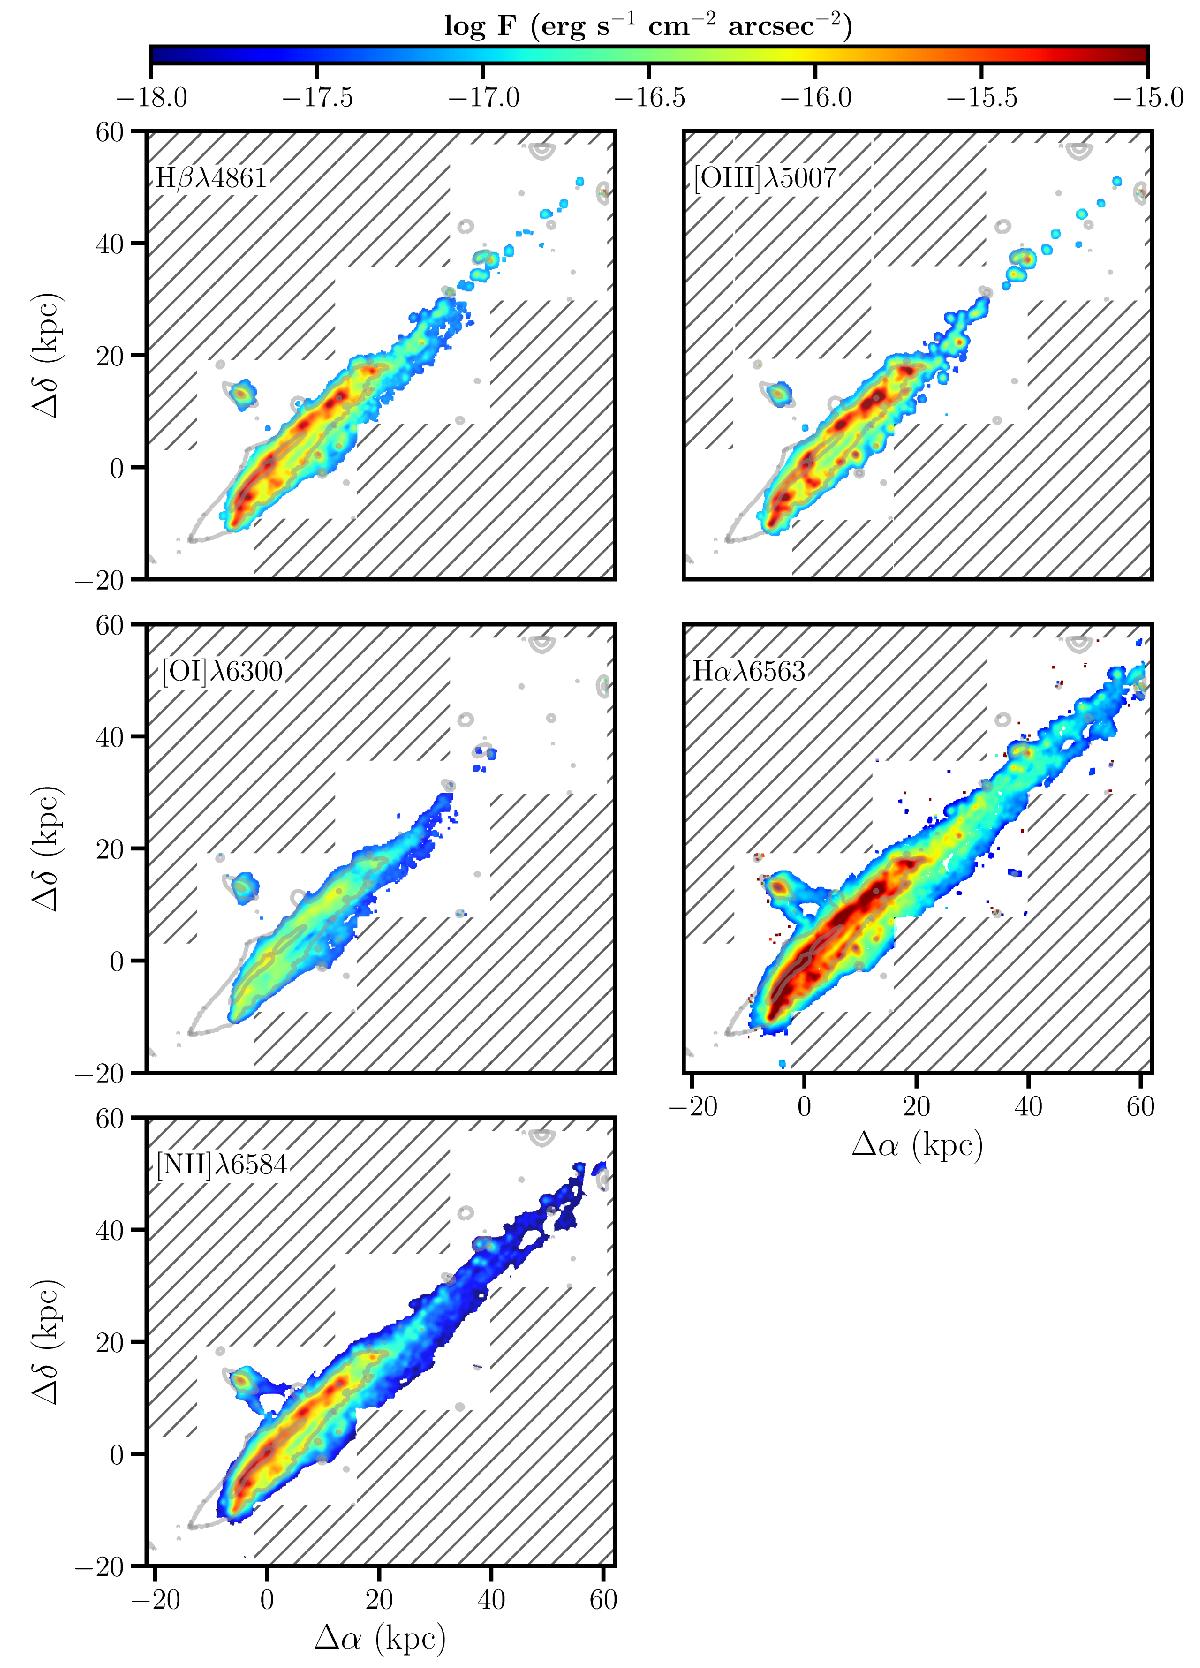
Emission line maps of UGC 6697. Panels are sorted by increasing wavelength from left to right and from top to bottom. The solid contours represents the 23th and the 20th mag arcsec-2 isophotes in the SDSS r-band image obtained from the datacube. Areas not mapped by the MUSE mosaic are shaded in gray.
Current usage metrics show cumulative count of Article Views (full-text article views including HTML views, PDF and ePub downloads, according to the available data) and Abstracts Views on Vision4Press platform.
Data correspond to usage on the plateform after 2015. The current usage metrics is available 48-96 hours after online publication and is updated daily on week days.
Initial download of the metrics may take a while.