Fig. 7
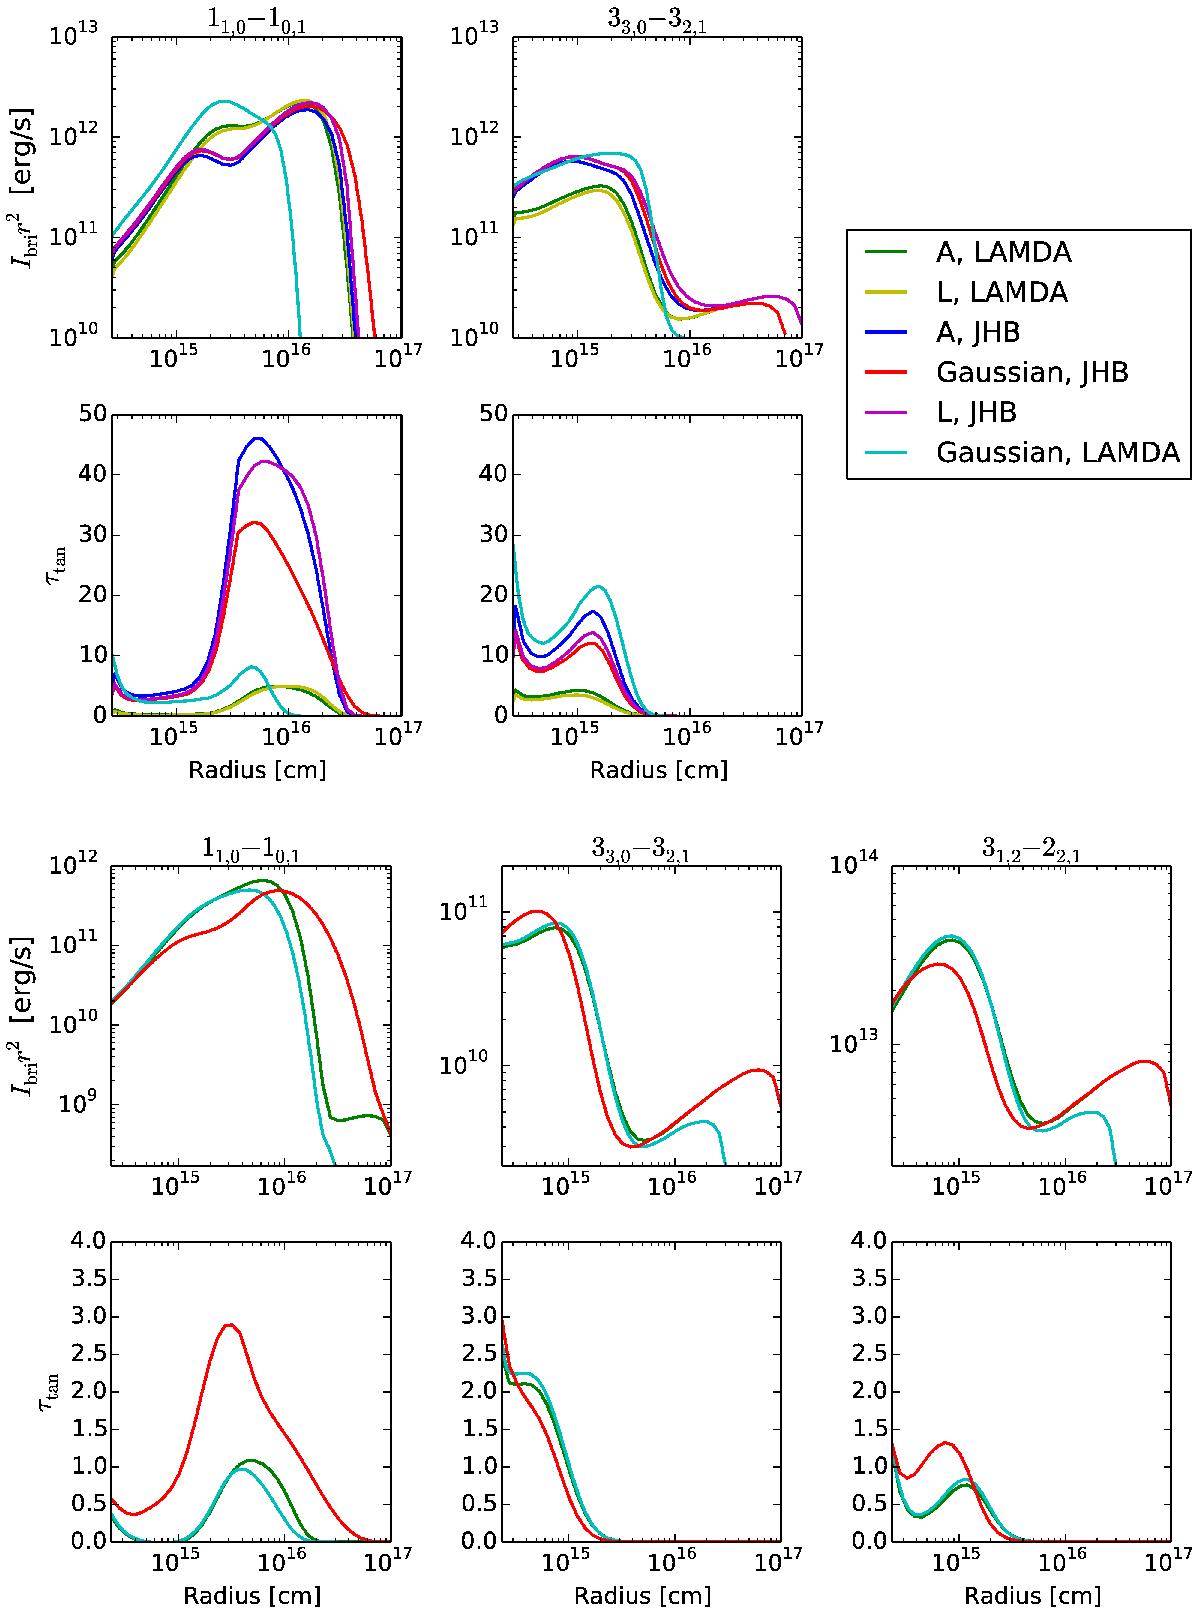
Results from various model fits to o-H2S for V1300 Aql (top) and IK Tau (bottom). Transition numbers at the top of a column indicate the line for which the parameters are plotted. The top row of the plot of each star shows the tangential brightness distribution of the emission line, Ibri, scaled with the radius squared, r2, to emphasise the features more clearly plotted against radius. The corresponding bottom row shows the tangential optical depth of the emission line with radius. The legend in the top right is given for V1300 Aql and also applies to the more sparsely selected lines for IK Tau.
Current usage metrics show cumulative count of Article Views (full-text article views including HTML views, PDF and ePub downloads, according to the available data) and Abstracts Views on Vision4Press platform.
Data correspond to usage on the plateform after 2015. The current usage metrics is available 48-96 hours after online publication and is updated daily on week days.
Initial download of the metrics may take a while.