Free Access
Fig. 3
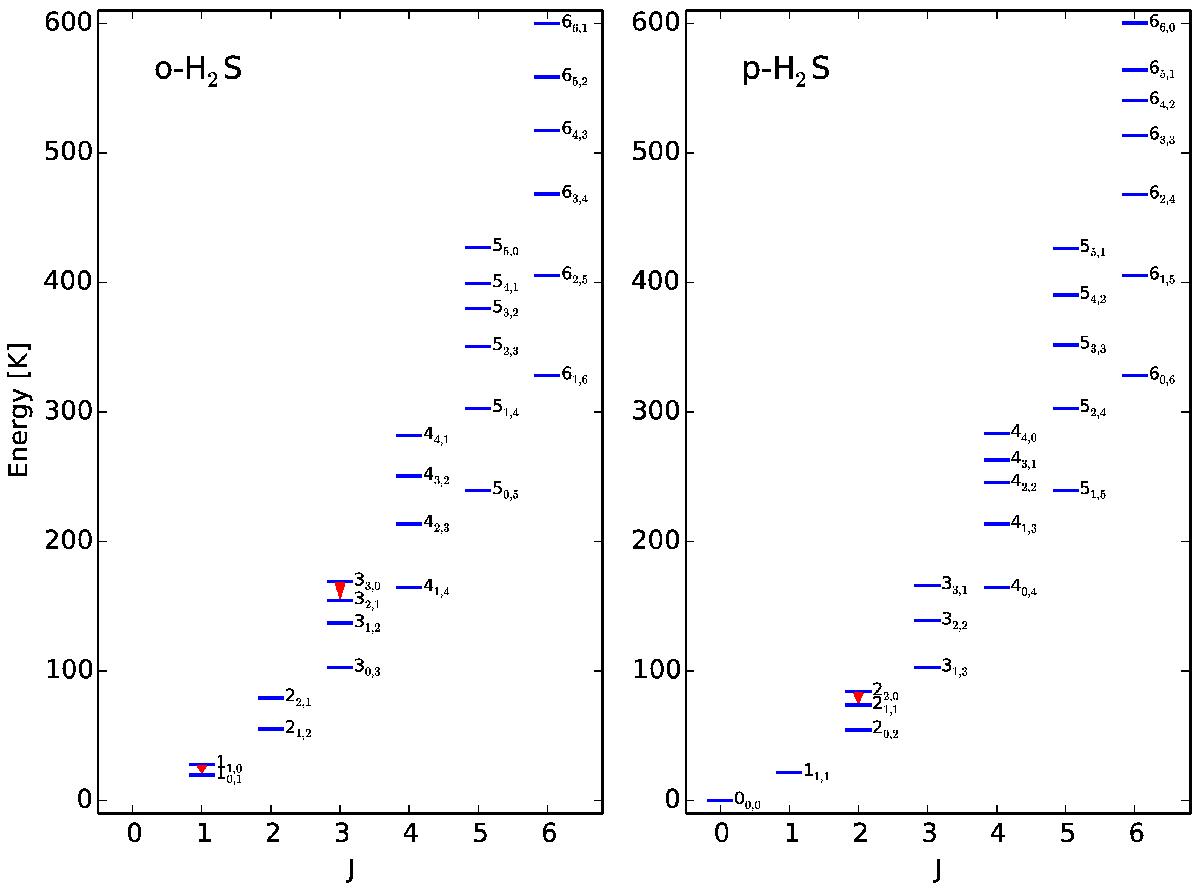
Energy level diagram for H2S with ortho energy levels shown on the left and para energy levels shown on the right. The quantum numbers are listed to the right of each level in the format JKa,Kc. The red wedges indicate the transitions observed by APEX as part of this study.
Current usage metrics show cumulative count of Article Views (full-text article views including HTML views, PDF and ePub downloads, according to the available data) and Abstracts Views on Vision4Press platform.
Data correspond to usage on the plateform after 2015. The current usage metrics is available 48-96 hours after online publication and is updated daily on week days.
Initial download of the metrics may take a while.