Fig. 3
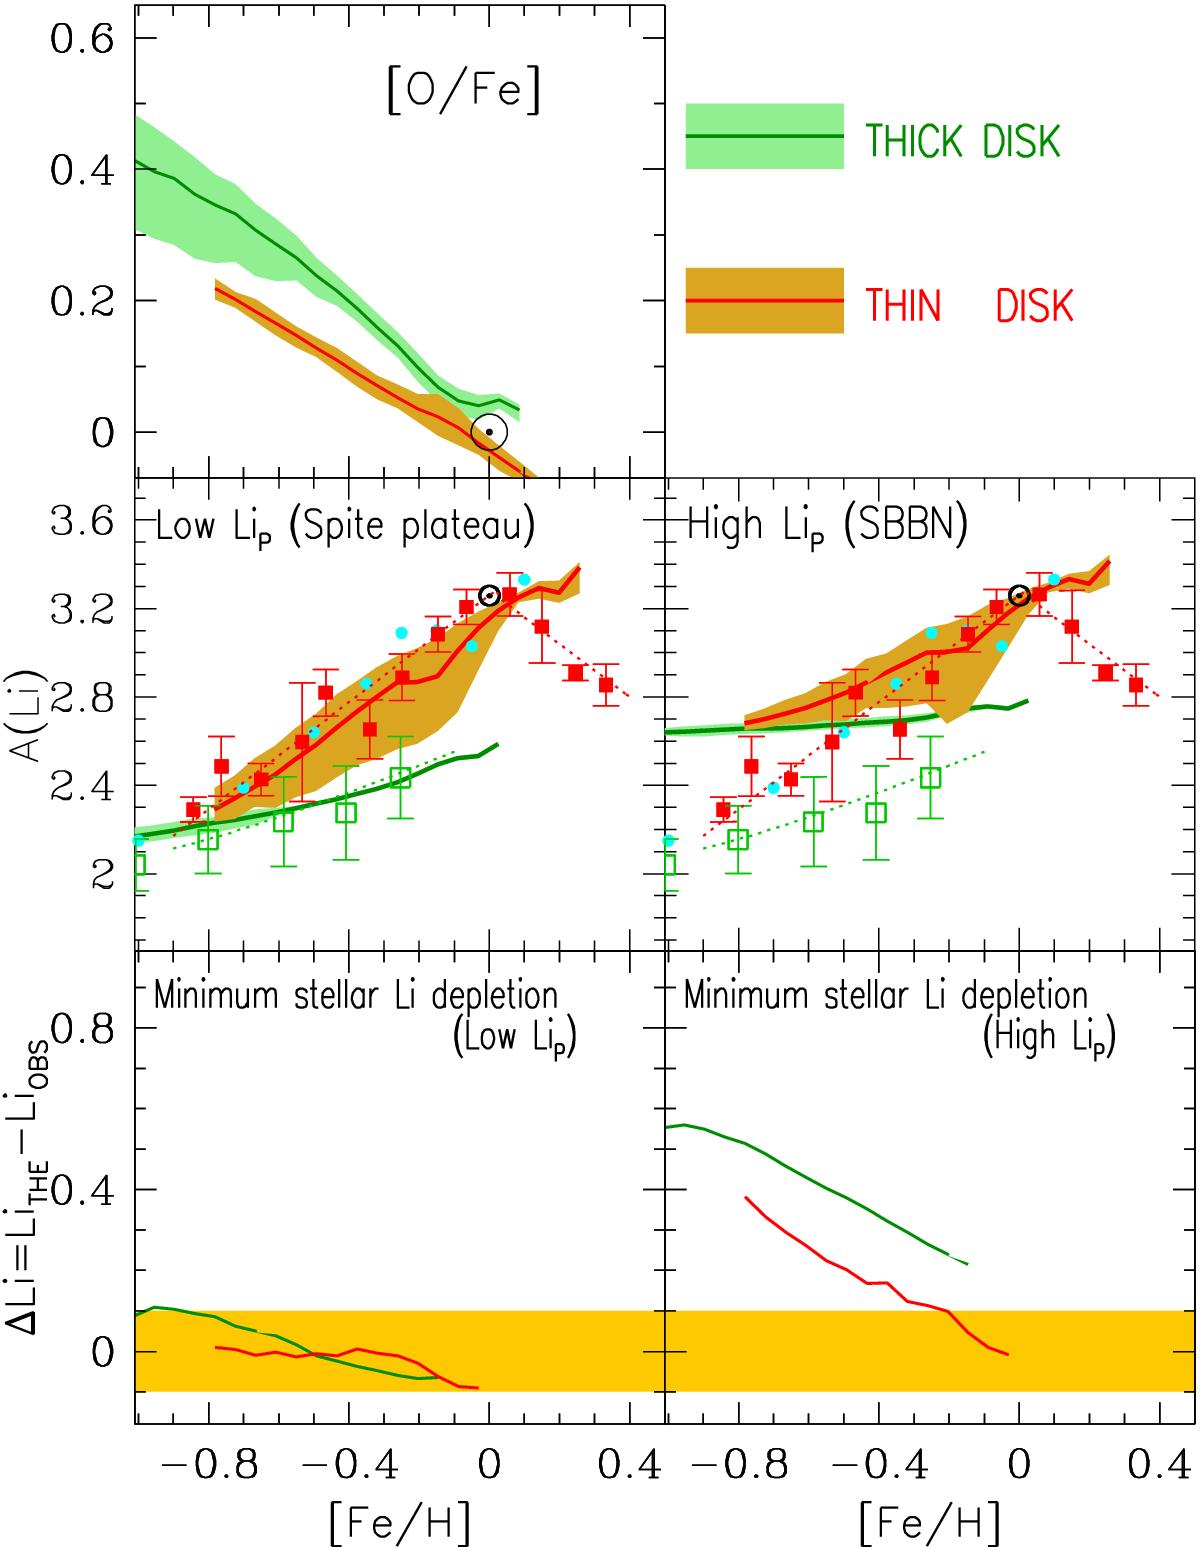
Evolution of abundances in the thick (green curve) and thin (red curve) disc of the Milky Way. Shaded areas display corresponding 1σ dispersion. The stellar Li source is 1.2−1.6 M⊙ red giants. Top: evolution of O/Fe. Middle: evolution of Li/H, starting with low (left) or high (right) primordial Li. Observations are from Fig. 1 and the dotted lines are fits to those data, used as approximations to derive the minimum depletion of Li (see text). Bottom: corresponding evolution of the required level of minimum depletion of Li inside stars. Shaded aereas in the bottom figure correspond to 1σ errors of 0.1 dex.
Current usage metrics show cumulative count of Article Views (full-text article views including HTML views, PDF and ePub downloads, according to the available data) and Abstracts Views on Vision4Press platform.
Data correspond to usage on the plateform after 2015. The current usage metrics is available 48-96 hours after online publication and is updated daily on week days.
Initial download of the metrics may take a while.