Fig. 1
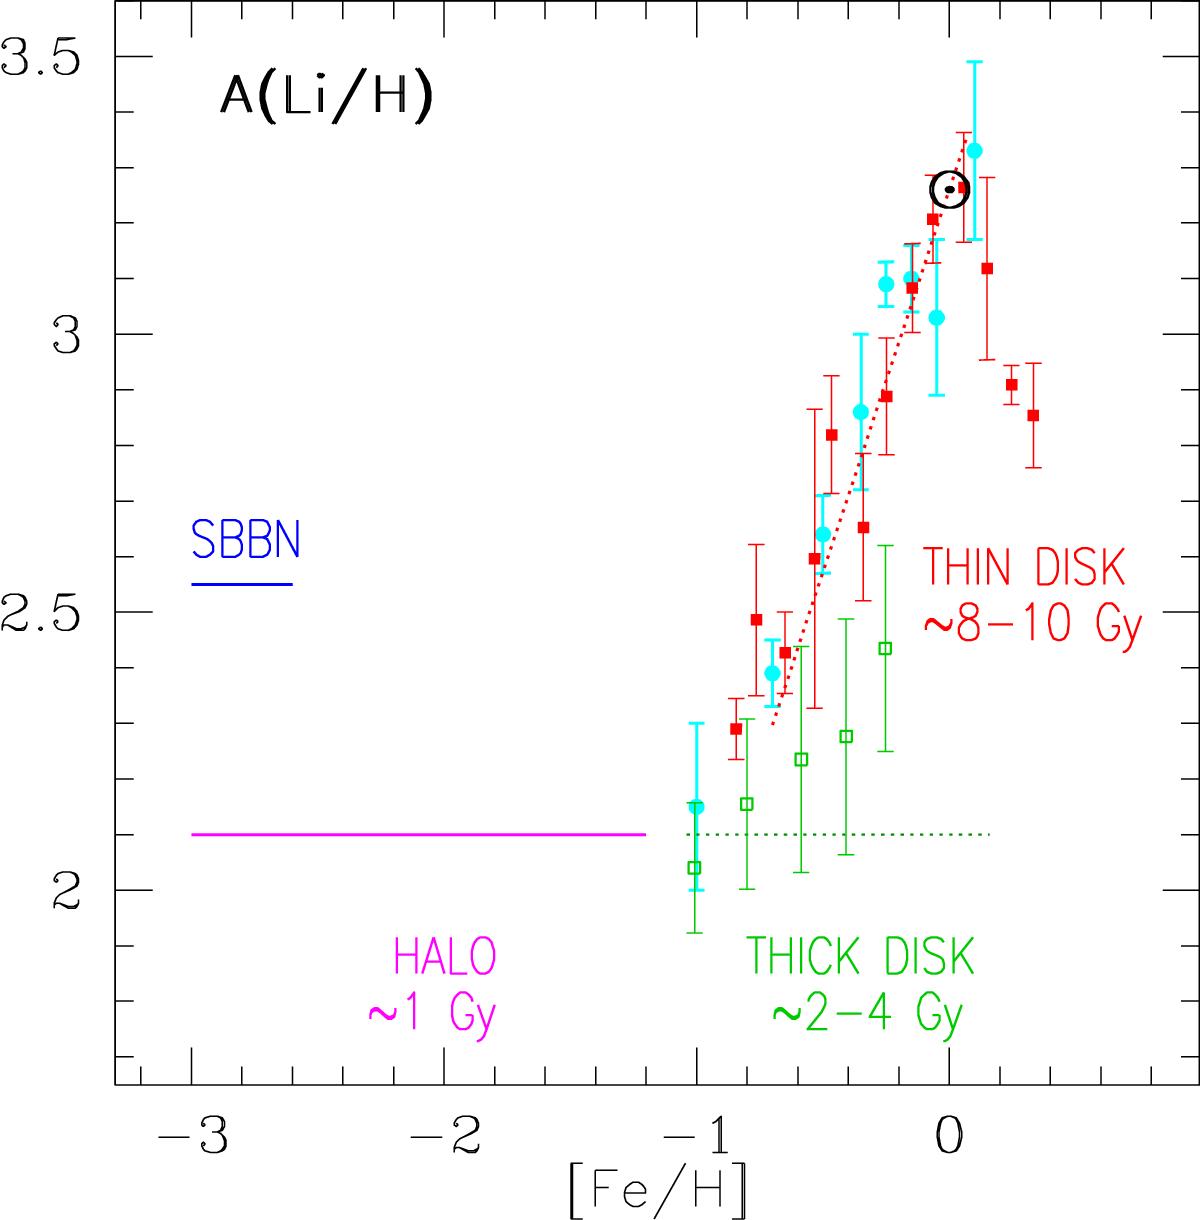
Observational constraints to the evolution of Li in stars of the halo and the thick and thin discs of the Milky Way. The Li abundance resulting from SBBN is shown in the upper left part of the figure and the Spite plateau for halo stars on the bottom left. Corresponding upper limits for the thick (green) and thin (red) discs are shown on the right. The dotted lines are upper limits from Ramírez et al. (2012). Blue filled circles with error bars represent the average Li abundances in the most Li rich stars of the corresponding metallicity bin in the sample of Lambert & Reddy (2004); no distinction between thin and thick discs is made in that work. The squares (filled for the thin disc and open for the thick disc) with error bars represent the average Li/H abundances of the most Li-rich stars in the AMBRE data of Guiglion et al. (2016).
Current usage metrics show cumulative count of Article Views (full-text article views including HTML views, PDF and ePub downloads, according to the available data) and Abstracts Views on Vision4Press platform.
Data correspond to usage on the plateform after 2015. The current usage metrics is available 48-96 hours after online publication and is updated daily on week days.
Initial download of the metrics may take a while.