Fig. 4
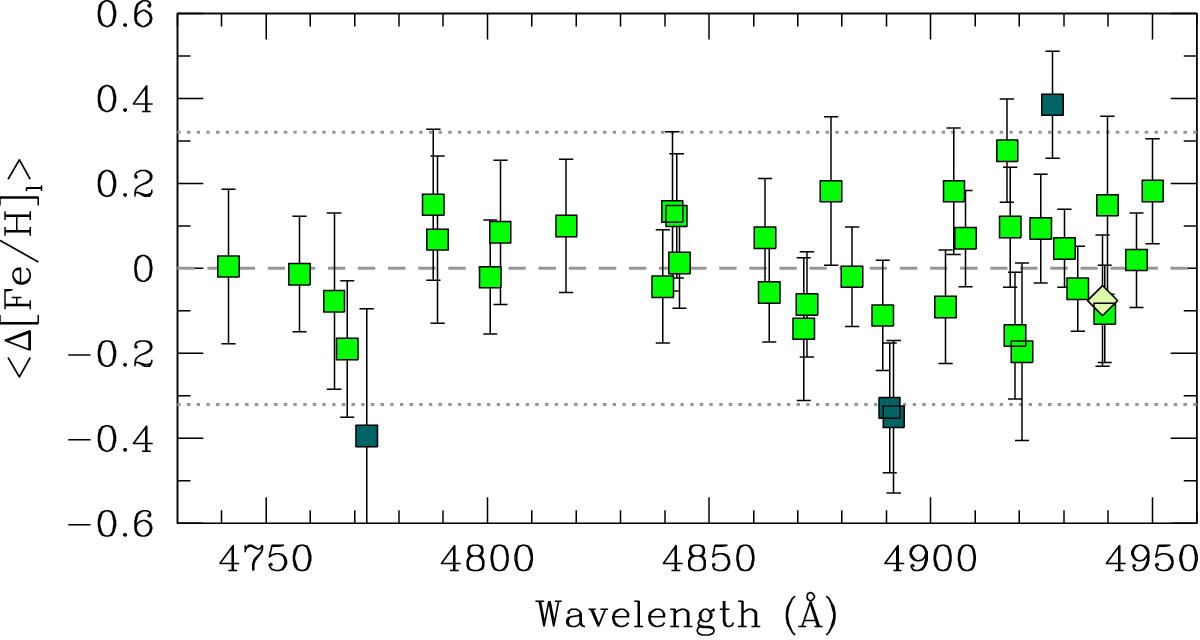
Average deviation of the measured Fe lines from the mean, as a function of wavelength. The standard deviation of the sample of stars is shown by an errorbar. The dotted lines show the 2σ interval of the scatter. Green squares are Fe I lines, while the one available Fe II line is a pale green diamond. Dark green squares are Fe I lines that deviate more than 2σ from the mean. We note that a different number of measurements goes into each point, depending on the number of stars in which the line could be measured.
Current usage metrics show cumulative count of Article Views (full-text article views including HTML views, PDF and ePub downloads, according to the available data) and Abstracts Views on Vision4Press platform.
Data correspond to usage on the plateform after 2015. The current usage metrics is available 48-96 hours after online publication and is updated daily on week days.
Initial download of the metrics may take a while.