Free Access
Fig. 2
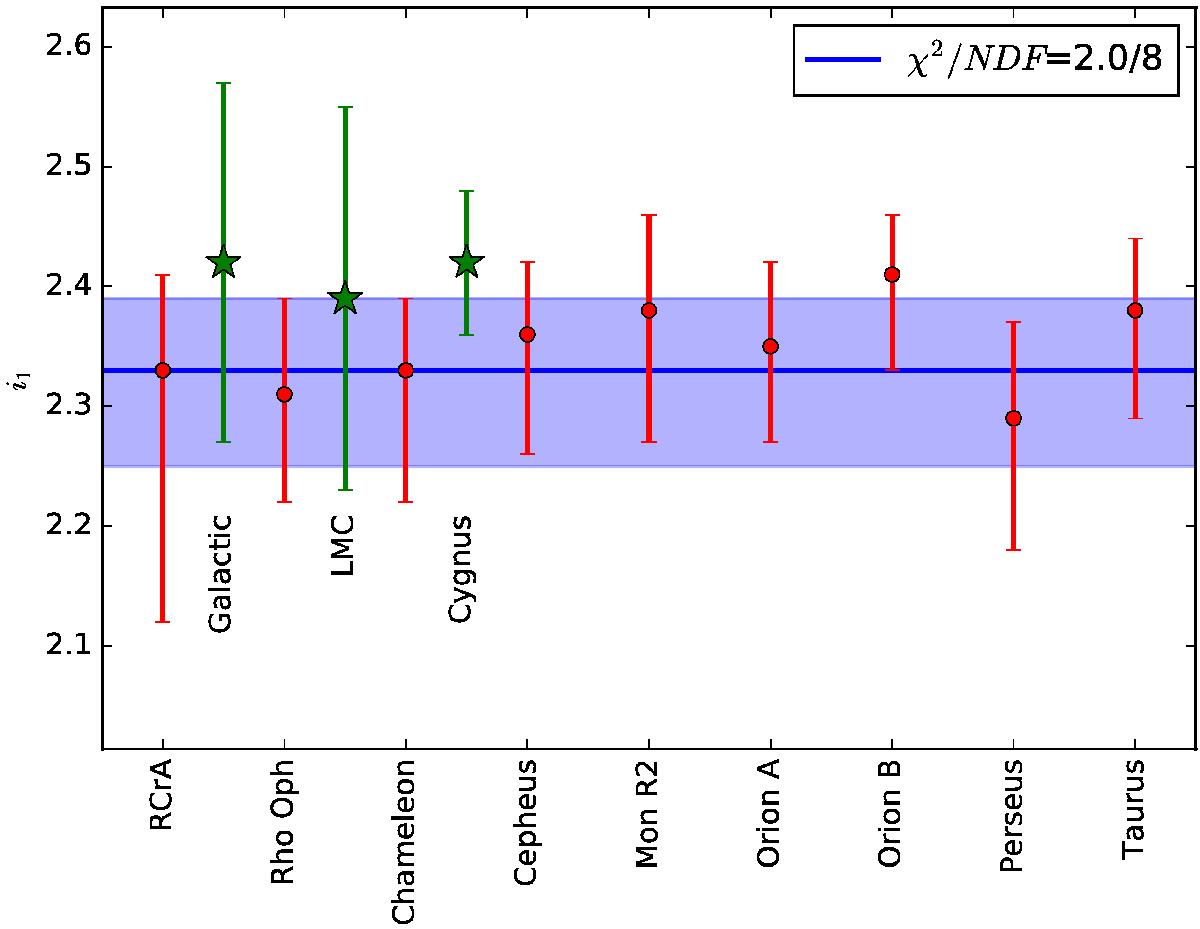
Best-fit low-energy index i1 for individual molecular clouds overplotted with the results from fitting the stacked spectrum. The green point marked with stars shows the slopes observed by Neronov & Malyshev (2015) in the Galactic disk, the LMC, and in the Cygnus region.
Current usage metrics show cumulative count of Article Views (full-text article views including HTML views, PDF and ePub downloads, according to the available data) and Abstracts Views on Vision4Press platform.
Data correspond to usage on the plateform after 2015. The current usage metrics is available 48-96 hours after online publication and is updated daily on week days.
Initial download of the metrics may take a while.