Fig. 9
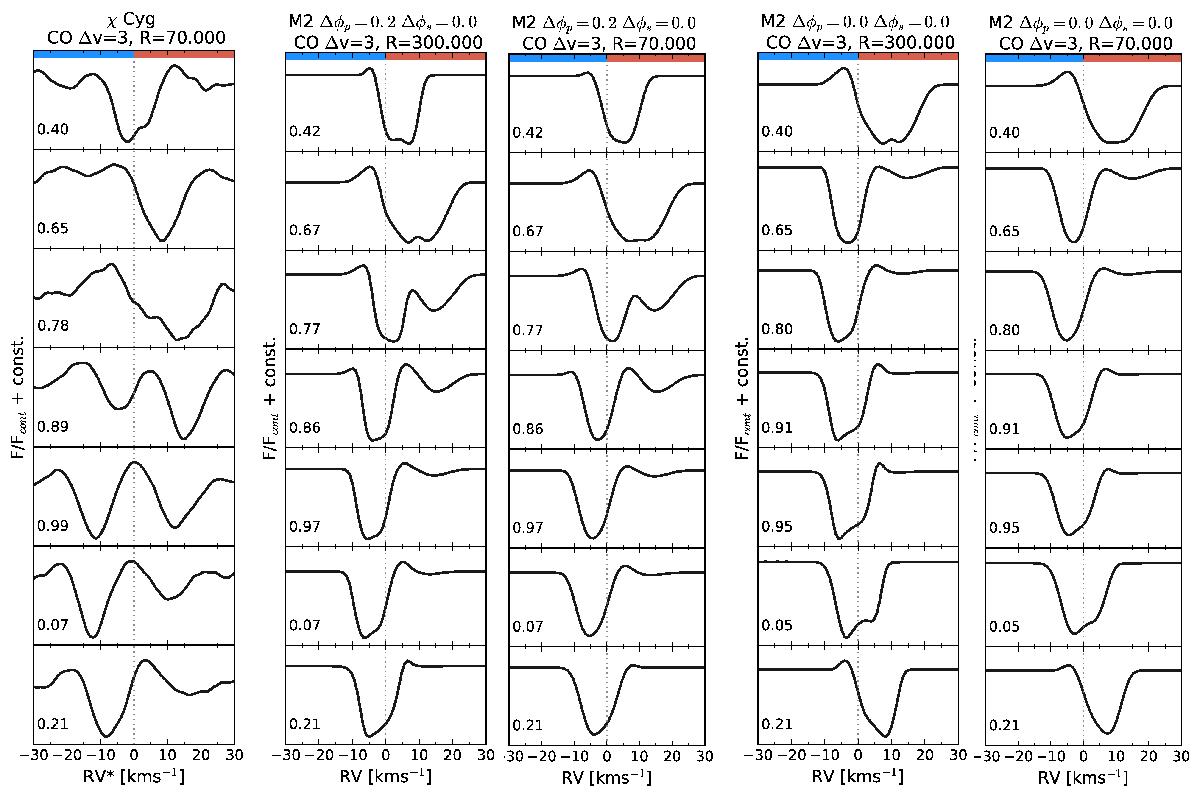
Line profiles from observations and from synthesis. The number is φv of that panel. Column 1 from the left: time series of an average of 10–20 unblended CO Δv = 3 lines, using FTS spectra of χ Cyg, taken from Lebzelter et al. (2001). Observed heliocentric velocities were converted to systemic velocities RV* using heliocentric centre of mass radial velocity CMRV = − 7.5 km s-1 from Hinkle et al. (1982). Column 2 and 3: synthetic CO Δv = 3 (5–2 P30) line profiles, from a model with Δφtot = 0.2, over a full cycle, shown for resolution 300 000 (Col. 2) and 70 000 (Col. 3). Column 4 and 5: synthetic CO Δv = 3 (5–2 P30) line profiles, from the original model, over a full cycle, shown for resolution 300 000 (Col. 4) and 70 000 (Col. 5).
Current usage metrics show cumulative count of Article Views (full-text article views including HTML views, PDF and ePub downloads, according to the available data) and Abstracts Views on Vision4Press platform.
Data correspond to usage on the plateform after 2015. The current usage metrics is available 48-96 hours after online publication and is updated daily on week days.
Initial download of the metrics may take a while.