Fig. 5
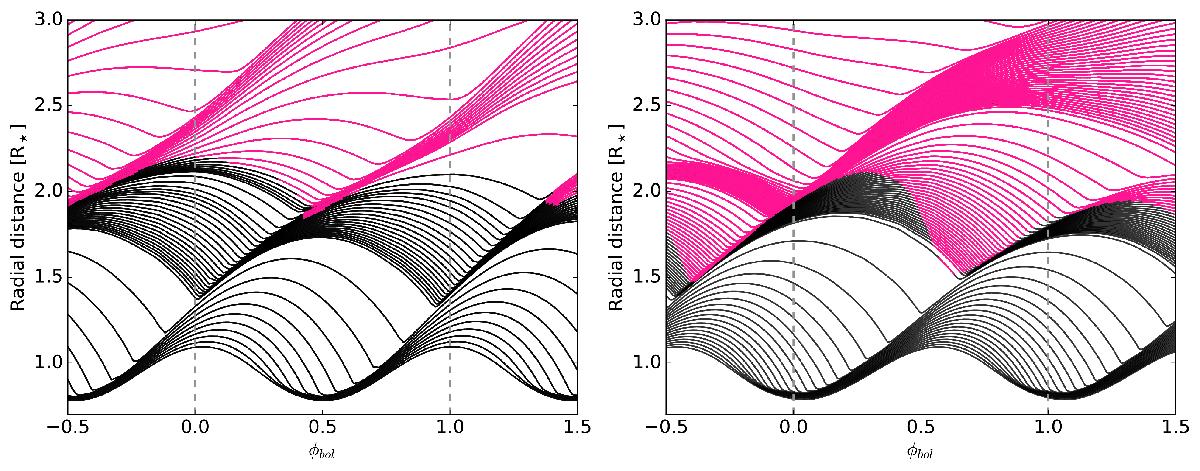
Mass shell plots for two models. Pink represents where more than 1% of the available Si has condensed, and indicates the presence of dust. Left: standard model Δφp = 0.0, Δφs = 0.0; dust forms just behind the shock wave, where the density is high, leading to efficient wind driving. Right: model Δφp = 0.4, Δφs = 0.0, with poor wind driving. Dust forms when matter is falling back onto the star, in a low-density region, resulting in significantly less matter condensing into dust, and therefore less material is accelerated in the wind.
Current usage metrics show cumulative count of Article Views (full-text article views including HTML views, PDF and ePub downloads, according to the available data) and Abstracts Views on Vision4Press platform.
Data correspond to usage on the plateform after 2015. The current usage metrics is available 48-96 hours after online publication and is updated daily on week days.
Initial download of the metrics may take a while.