Fig. 4
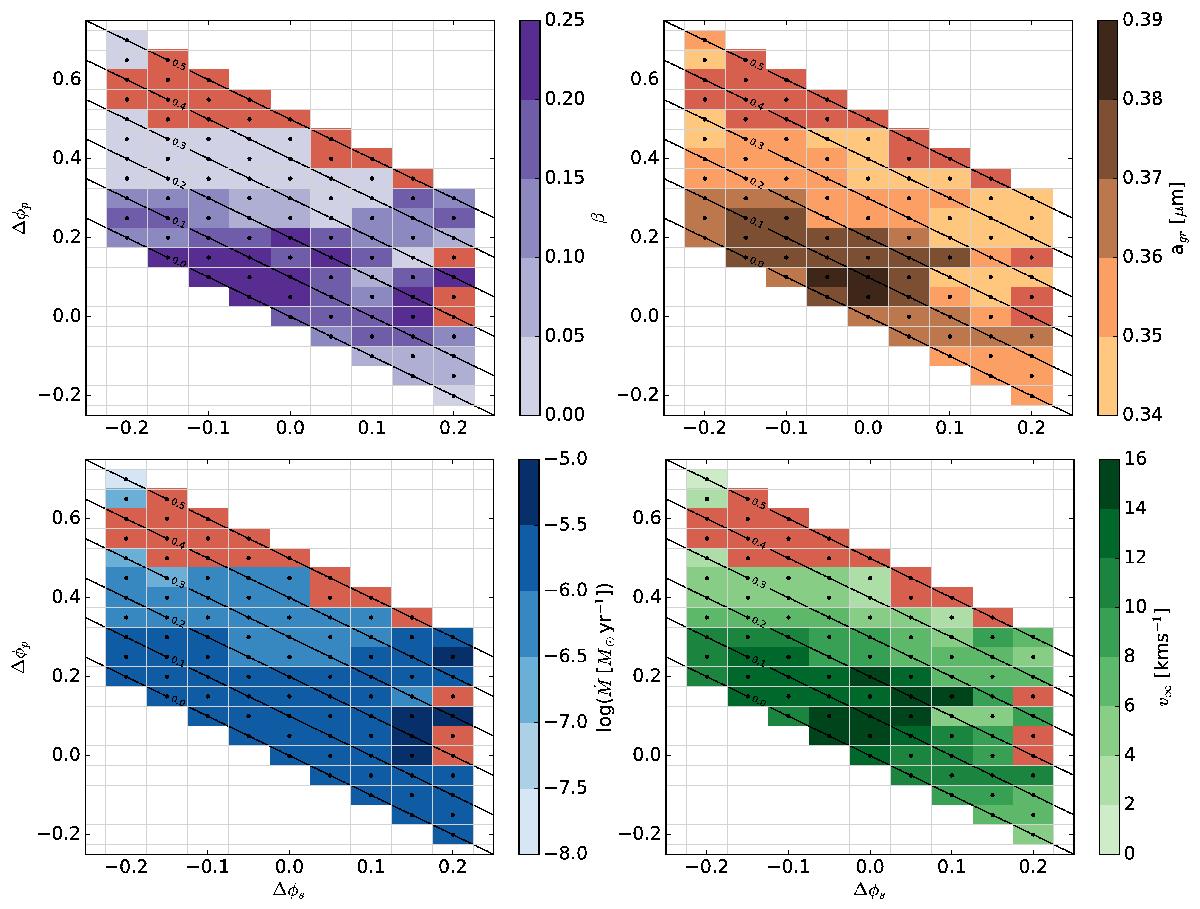
Overview of the calculated models, showing the dependence on Δφs, Δφp and Δφtot. Each square represents one model, and the colours indicate physical properties. The red squares are models that did not converge (see Sect. 2.1.2). Upper left: β, the fraction of momentum available from the luminosity that has gone into driving the wind. Upper right: final radius of the dust grains. Lower left: Log of the mass-loss rate. Lower right: wind velocity of the models.
Current usage metrics show cumulative count of Article Views (full-text article views including HTML views, PDF and ePub downloads, according to the available data) and Abstracts Views on Vision4Press platform.
Data correspond to usage on the plateform after 2015. The current usage metrics is available 48-96 hours after online publication and is updated daily on week days.
Initial download of the metrics may take a while.