Fig. 4
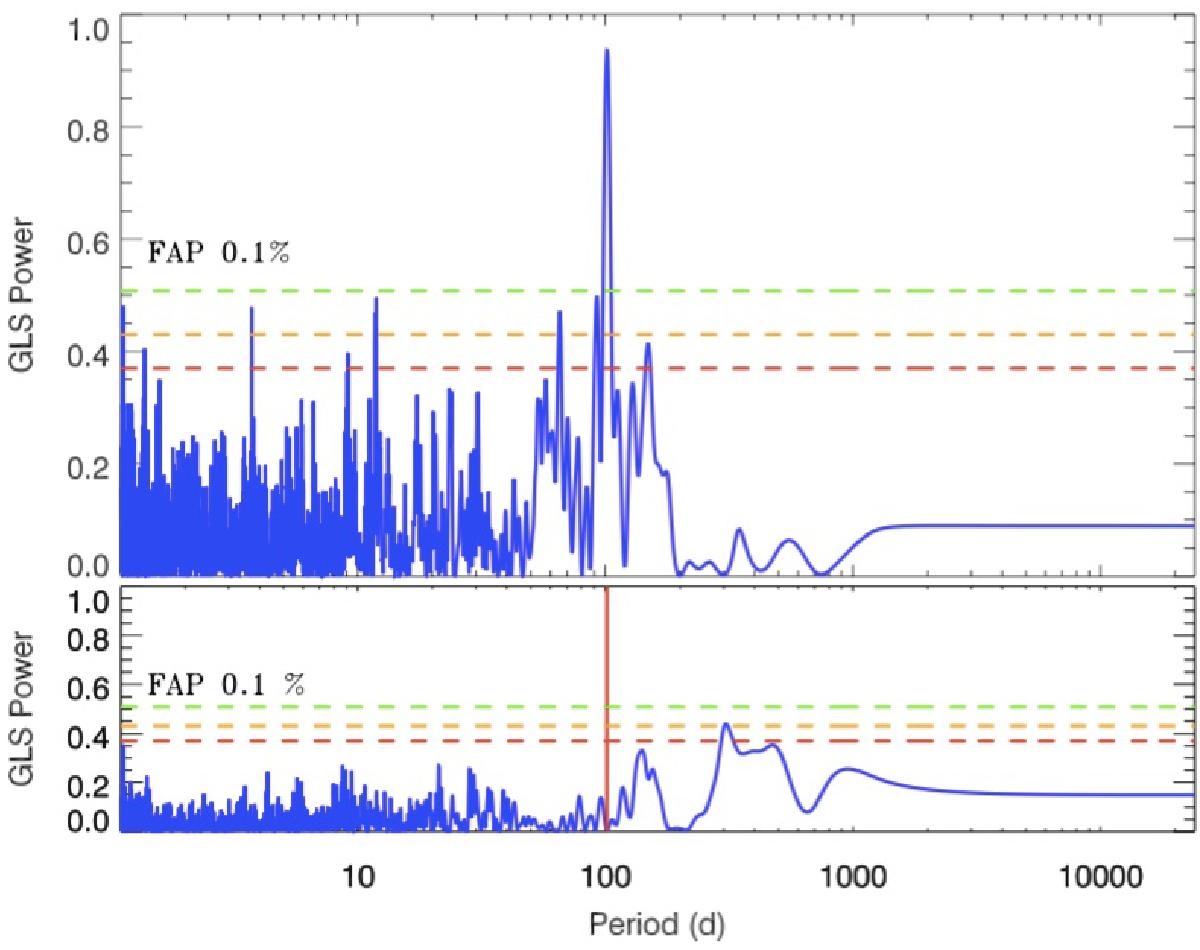
Top panel: GLS periodogram of RVs measured with HARPS-N with a significant peak at 101.54 days, the horizontal dashed lines represent the false alarm probabilities (FAP) of 0.1% (green line), 1% (orange) and 10% (red), respectively. Botton panel: periodogram of the residuals data after subtracting the orbital fit. The red solid line indicates the location of the maximum period found with the RV.
Current usage metrics show cumulative count of Article Views (full-text article views including HTML views, PDF and ePub downloads, according to the available data) and Abstracts Views on Vision4Press platform.
Data correspond to usage on the plateform after 2015. The current usage metrics is available 48-96 hours after online publication and is updated daily on week days.
Initial download of the metrics may take a while.