Fig. 10
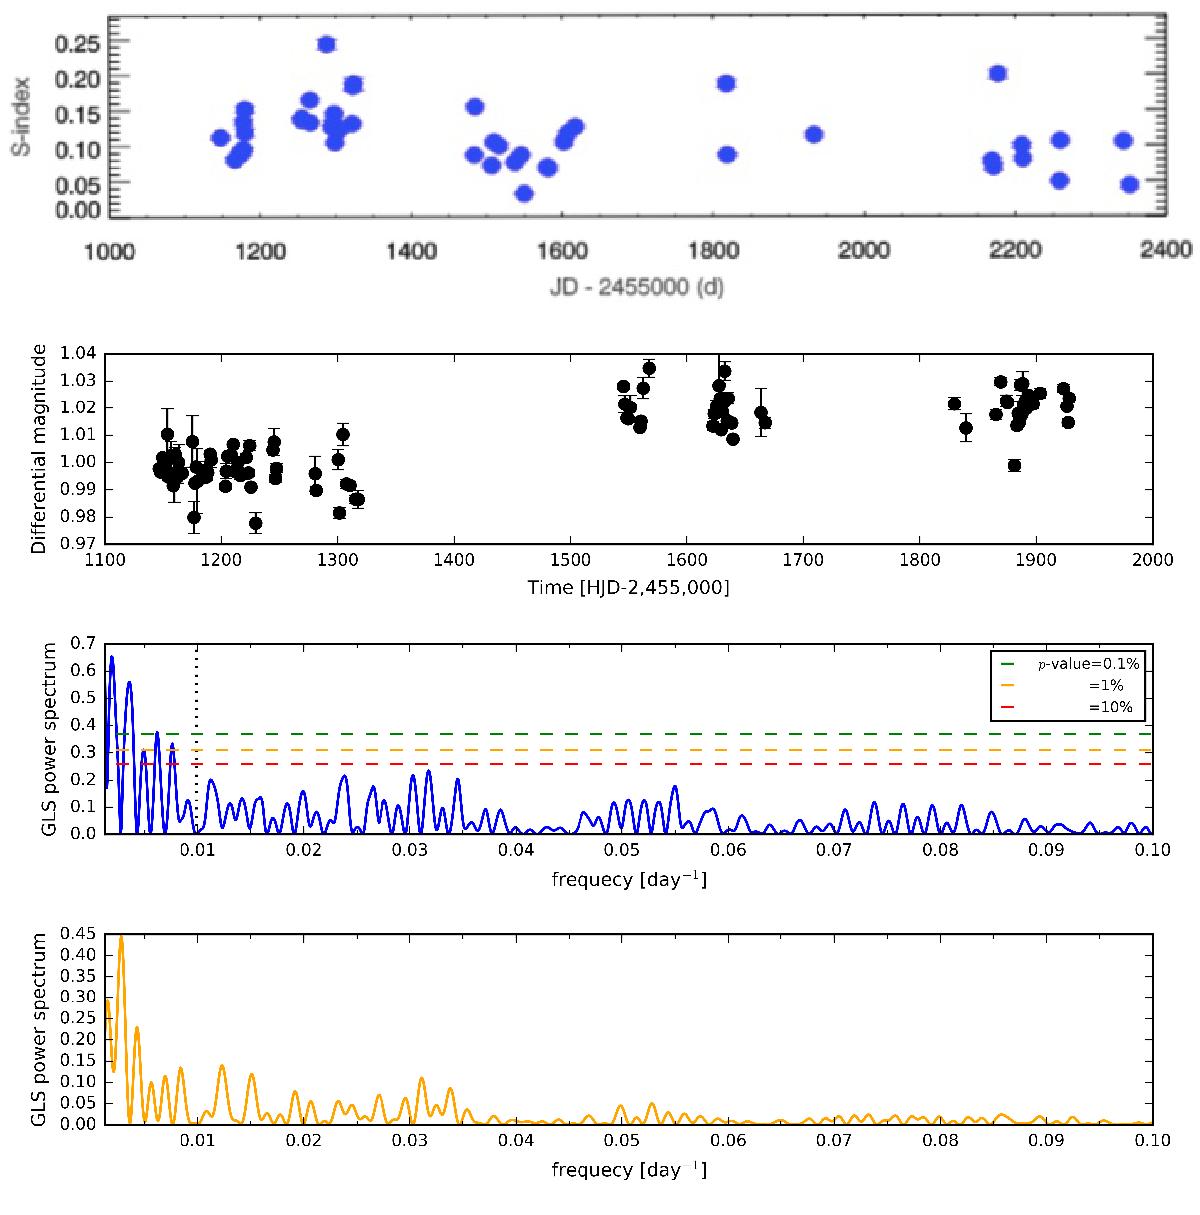
Upper panel: time serie of the S-index. Middle-upper panel: differential light curve of TYC 4282-605-1 collected by the APACHE survey. Middle-bottom panel: generalized Lomb-Scargle (GLS) periodogram of the differential light curve. The dotted vertical line marks the orbital period of the TYC 4282-605-1 companion. Bottom panel: spectral window function of the APACHE observations.
Current usage metrics show cumulative count of Article Views (full-text article views including HTML views, PDF and ePub downloads, according to the available data) and Abstracts Views on Vision4Press platform.
Data correspond to usage on the plateform after 2015. The current usage metrics is available 48-96 hours after online publication and is updated daily on week days.
Initial download of the metrics may take a while.