Free Access
Fig. 9
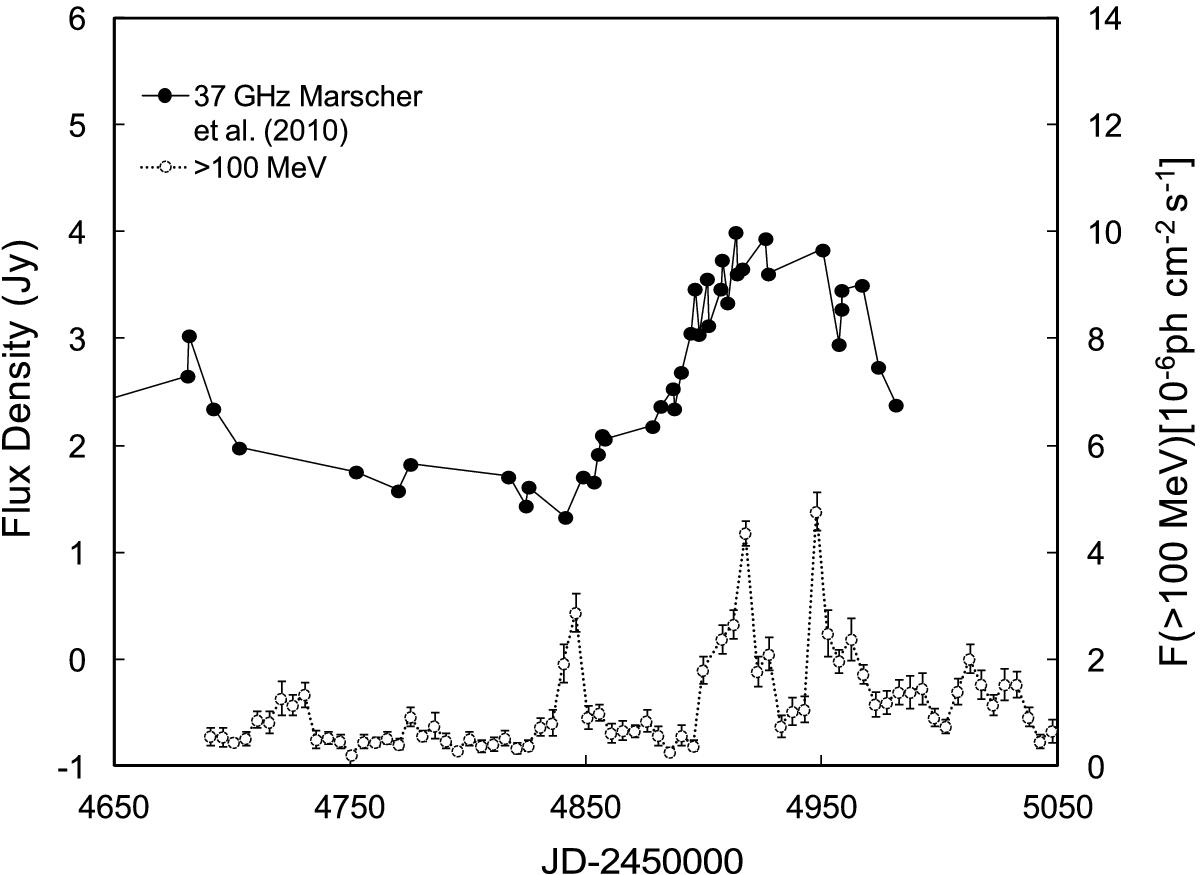
Light curves of PKS 1510-089 at 37 GHz (black dots) obtained by Marscher et al. (2010) and at γ-rays (band 3 data from Fermi-LAT, white dots). The radio light curve was shifted by 54 days, the same time delay as in Fig. 3.
Current usage metrics show cumulative count of Article Views (full-text article views including HTML views, PDF and ePub downloads, according to the available data) and Abstracts Views on Vision4Press platform.
Data correspond to usage on the plateform after 2015. The current usage metrics is available 48-96 hours after online publication and is updated daily on week days.
Initial download of the metrics may take a while.