Fig. 10
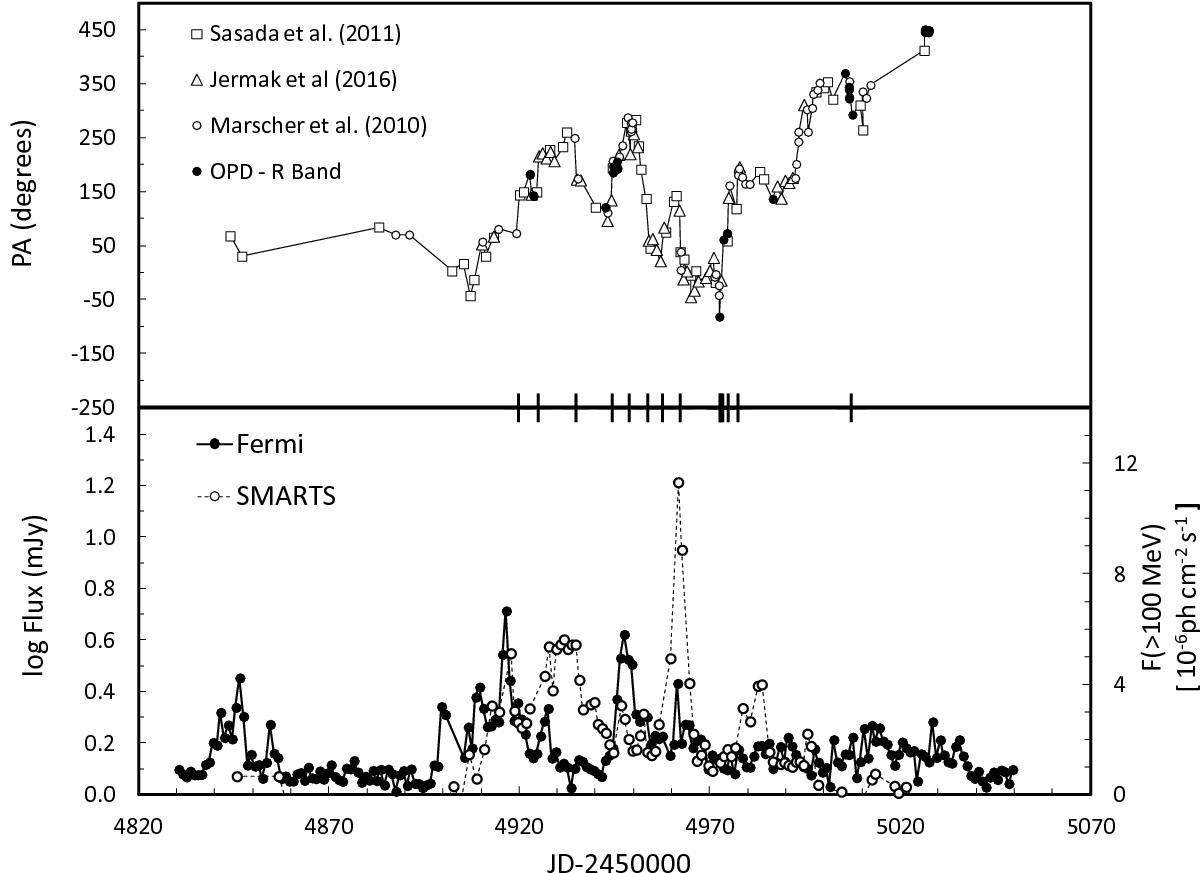
Top: PA variability combining the results obtained in this work with those of Marscher et al. (2010), Sasada et al. (2011), and Jermak et al. (2016). Bottom: SMARTS R band and Fermi-LAT light curves. Vertical marks in the time axis represent the epochs in which rotations of more than 50° were detected in intervals of one day.
Current usage metrics show cumulative count of Article Views (full-text article views including HTML views, PDF and ePub downloads, according to the available data) and Abstracts Views on Vision4Press platform.
Data correspond to usage on the plateform after 2015. The current usage metrics is available 48-96 hours after online publication and is updated daily on week days.
Initial download of the metrics may take a while.