Fig. 1
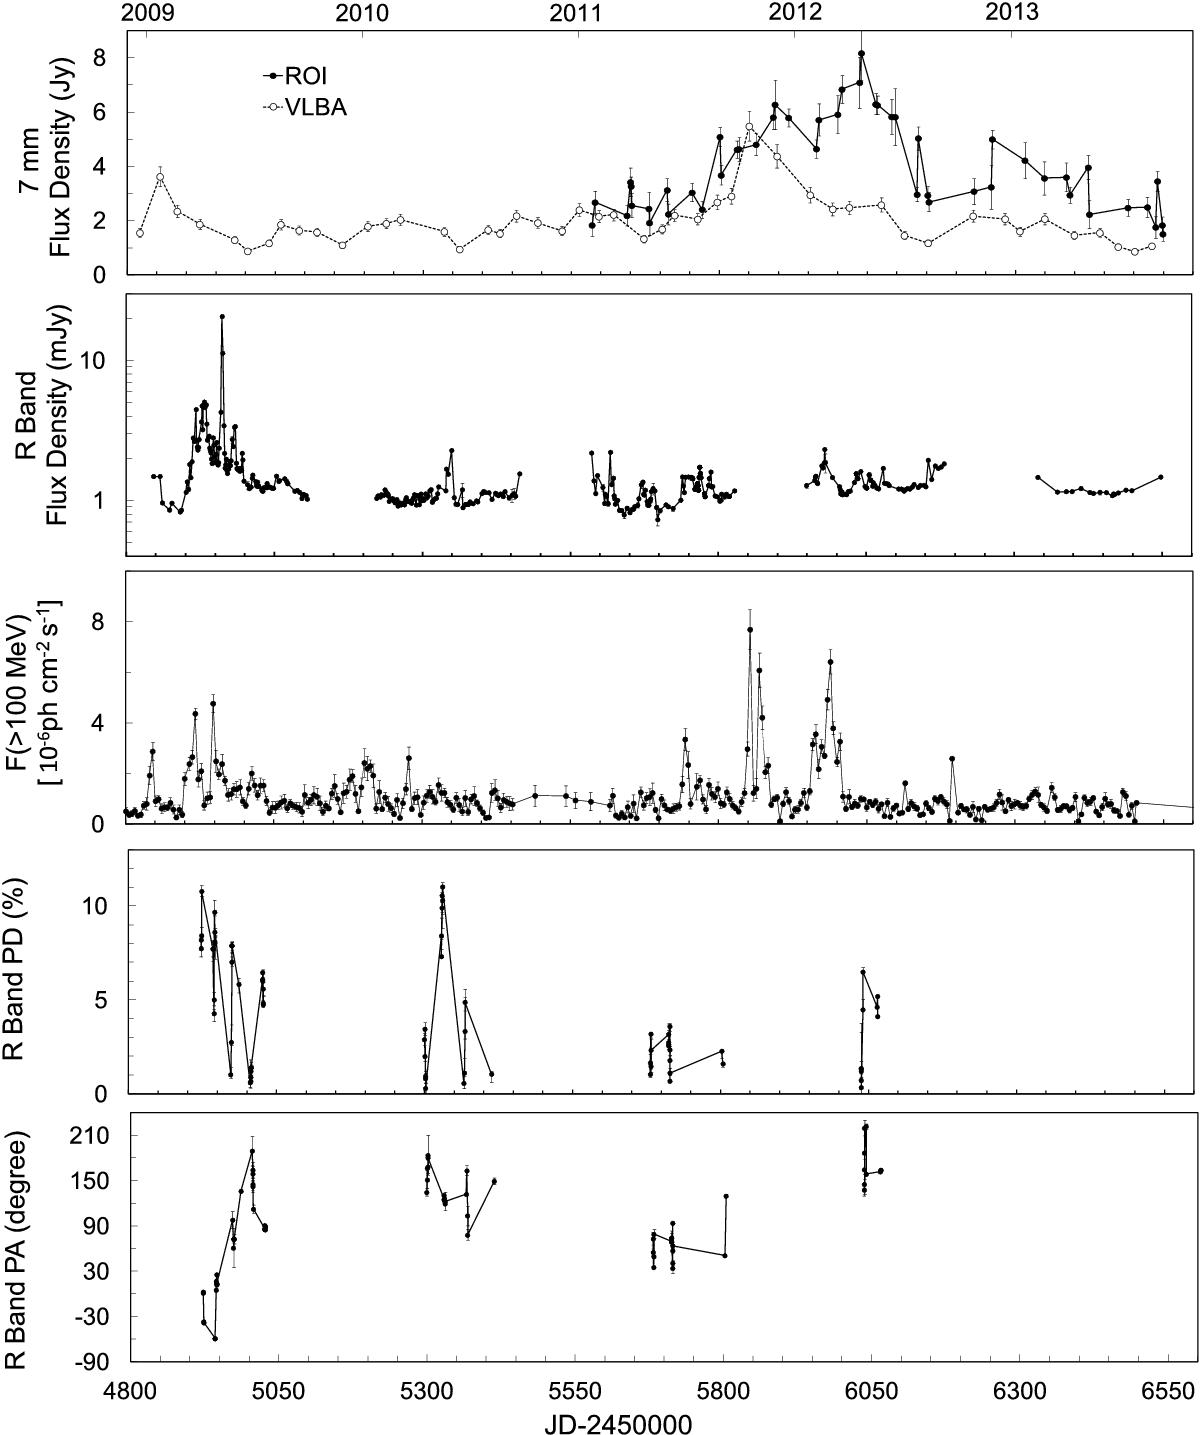
From top to bottom: 7 mm radio light curve obtained in this work together with the 7 mm peak flux density of VLBA images obtained from the VLBI-BU BLAZAR monitoring programme; R-band photometry from SMARTS (Bonning et al. 2012); Fermi-LAT γ-ray light curve for energies >100 MeV, binned in five-day intervals (Abdo et al. 2009a,b, 2010c); R-band polarization degree and position angle obtained in this work.
Current usage metrics show cumulative count of Article Views (full-text article views including HTML views, PDF and ePub downloads, according to the available data) and Abstracts Views on Vision4Press platform.
Data correspond to usage on the plateform after 2015. The current usage metrics is available 48-96 hours after online publication and is updated daily on week days.
Initial download of the metrics may take a while.