Fig. 6
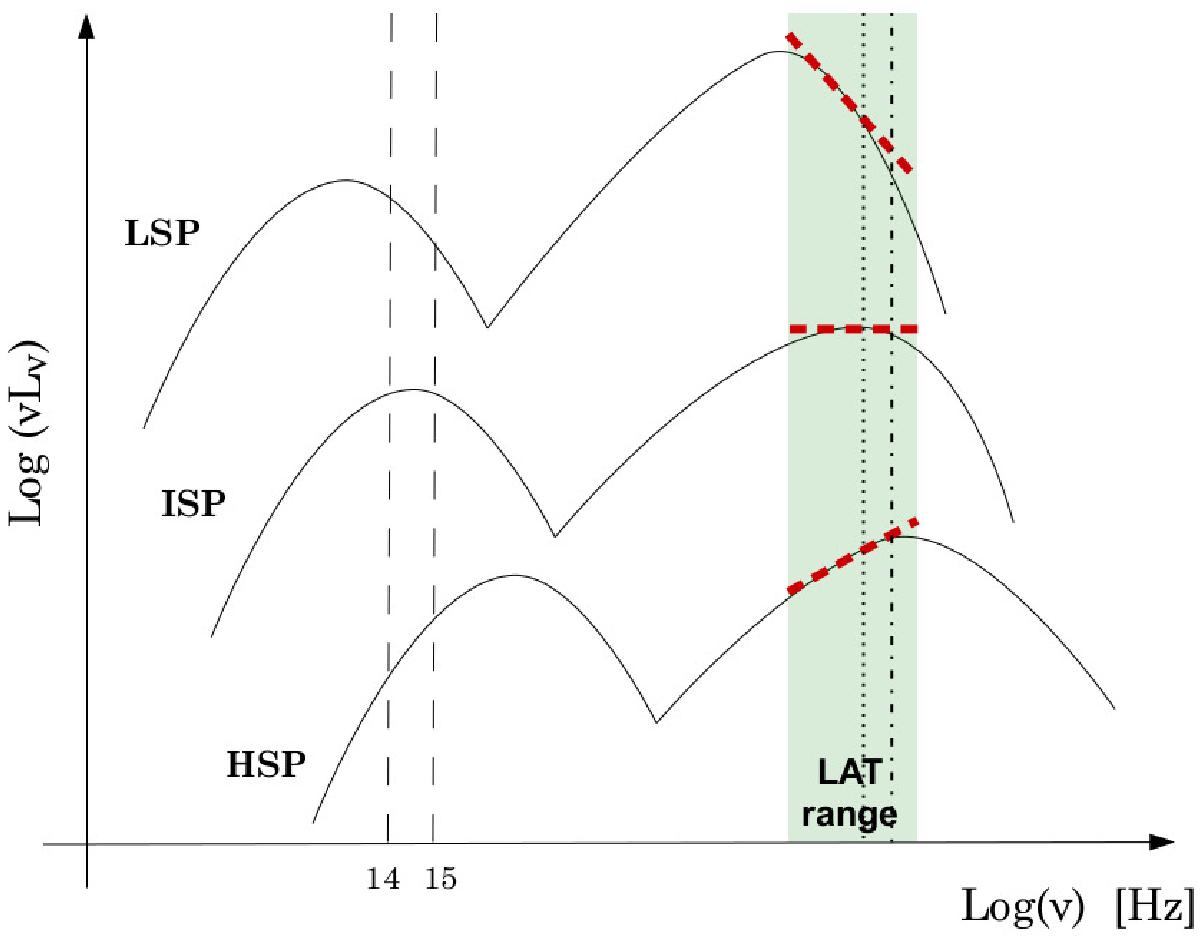
Schematic representation of LSP (upper curve), ISP (middle curve) and HSP (lower curve) blazar spectral classification, according to the position of ![]() . The green filled area represents the 0.1−300 GeV 3FGL energy range, while the black dotted and dash-dotted vertical lines represent the 1FHL and 2FHL energy thresholds, respectively.
. The green filled area represents the 0.1−300 GeV 3FGL energy range, while the black dotted and dash-dotted vertical lines represent the 1FHL and 2FHL energy thresholds, respectively.
Current usage metrics show cumulative count of Article Views (full-text article views including HTML views, PDF and ePub downloads, according to the available data) and Abstracts Views on Vision4Press platform.
Data correspond to usage on the plateform after 2015. The current usage metrics is available 48-96 hours after online publication and is updated daily on week days.
Initial download of the metrics may take a while.