Free Access
Fig. 5
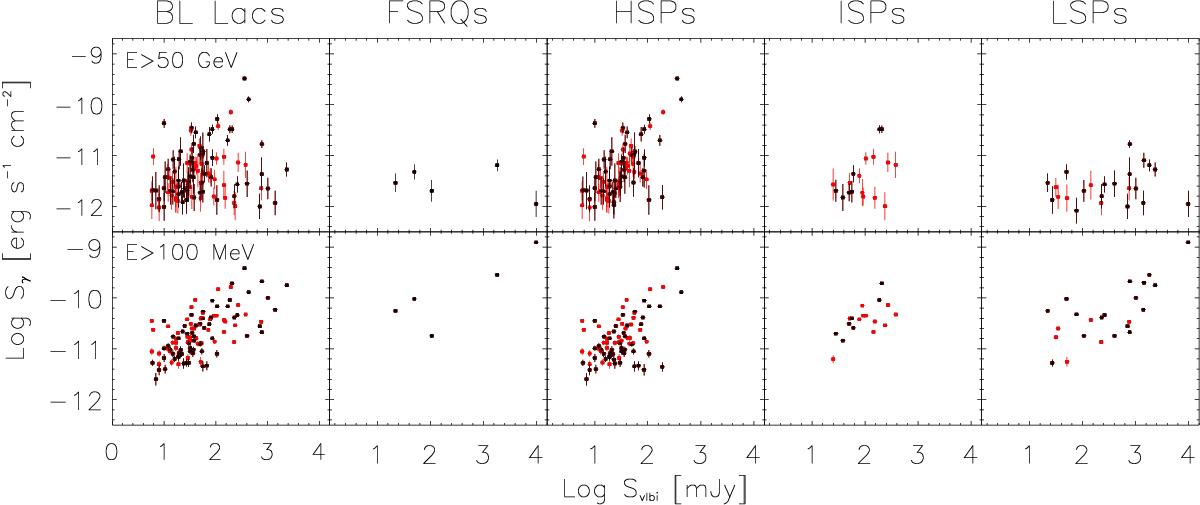
VLBI flux density versus 2FHL (upper panels) and 3FGL (lower panels) energy flux scatter plots for BL Lacs, FSRQs, HSPs, ISPs, and LSPs, belonging to the 2FHL-n sample. The black and red symbols represent sources with or without redshift, respectively.
Current usage metrics show cumulative count of Article Views (full-text article views including HTML views, PDF and ePub downloads, according to the available data) and Abstracts Views on Vision4Press platform.
Data correspond to usage on the plateform after 2015. The current usage metrics is available 48-96 hours after online publication and is updated daily on week days.
Initial download of the metrics may take a while.