Fig. 9
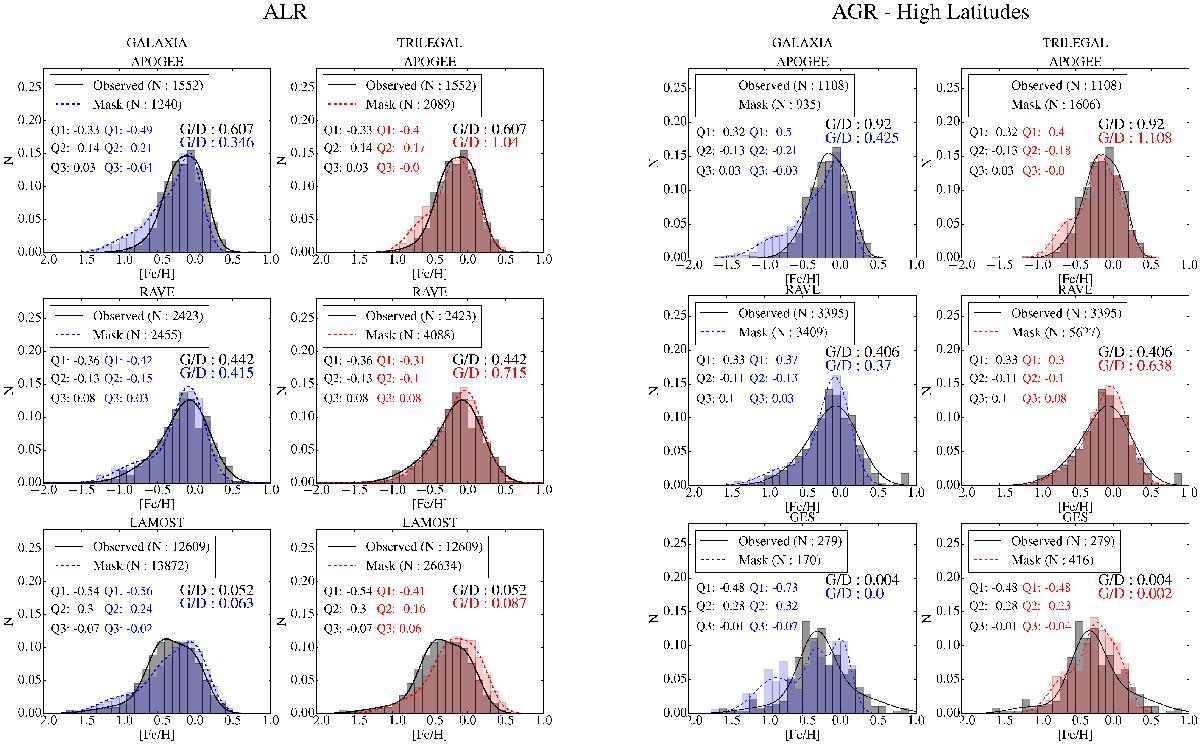
Mask and observed normalized MDF for ALR (left) and AGR (right) in the R − Z range of 7 ≤ R ≤ 9 kpc and 0 ≤ | Z | ≤ 2 kpc. The survey histograms are in black, while GALAXIA and TRILEGAL histograms are in blue and red, respectively. Histograms are normalized by dividing the counts in each 0.1 dex bin by the total number of sources. The distributions in black line represent the observed MDF, while those in blue and red lines represent the mask MDF for GALAXIA and TRILEGAL, respectively. APOGEE and RAVE distributions are shown in the top and middle rows, respectively, and the LAMOST (left) and GES (right) in the bottom row. Quartile values for both distributions are given in each panel colour-coded according to the distribution. Indicated is also the giant-to-dwarf ratio for mask and observed samples of each survey for both models.
Current usage metrics show cumulative count of Article Views (full-text article views including HTML views, PDF and ePub downloads, according to the available data) and Abstracts Views on Vision4Press platform.
Data correspond to usage on the plateform after 2015. The current usage metrics is available 48-96 hours after online publication and is updated daily on week days.
Initial download of the metrics may take a while.