Fig. 8
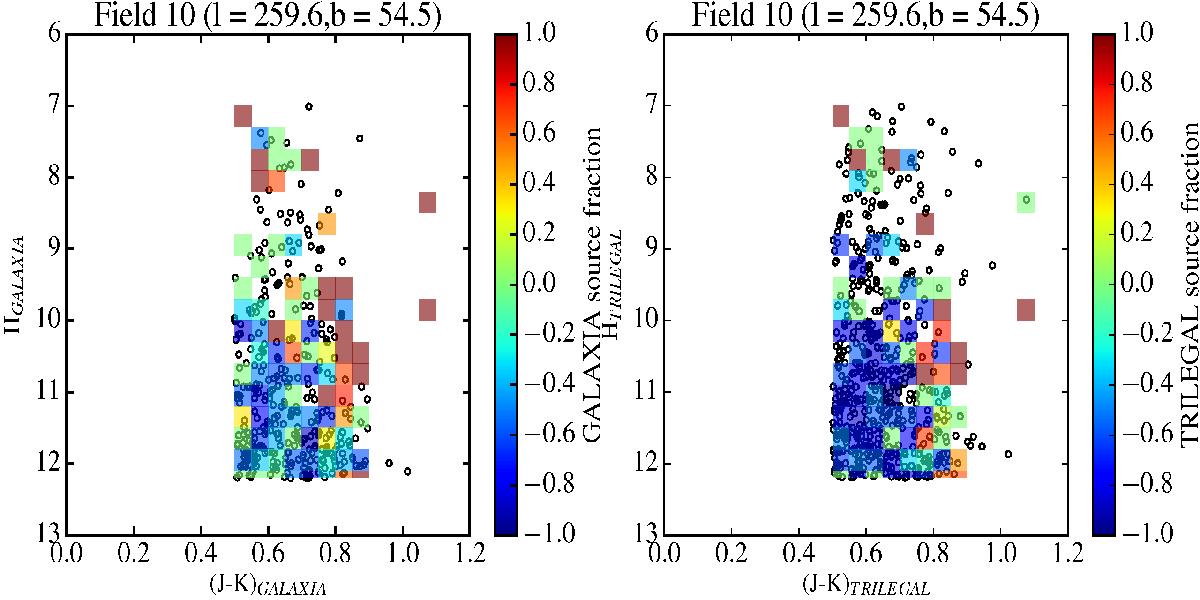
CMD diagrams for the APOGEE field located towards l,b ~ 59.6°, 54.5° with GALAXIA and TRILEGAL source distribution shown in the left and right panels, respectively. The open circles in each panel represent the respective model sources. The rectangular boxes are the masks where the real observed sources are, each colour-coded with the fraction (N2MASS − Nmodel)/N2MASS if N2MASS>Nmodel or (N2MASS − Nmodel)/Nmodel if N2MASS<Nmodel. The redder colours indicate that the 2MASS sources are in equal number or greater than the number of model sources, while bluer colours denote more model sources. From the colours of the bins, there are more TRILEGAL sources than GALAXIA sources towards the faint magnitudes.
Current usage metrics show cumulative count of Article Views (full-text article views including HTML views, PDF and ePub downloads, according to the available data) and Abstracts Views on Vision4Press platform.
Data correspond to usage on the plateform after 2015. The current usage metrics is available 48-96 hours after online publication and is updated daily on week days.
Initial download of the metrics may take a while.