Fig. 10
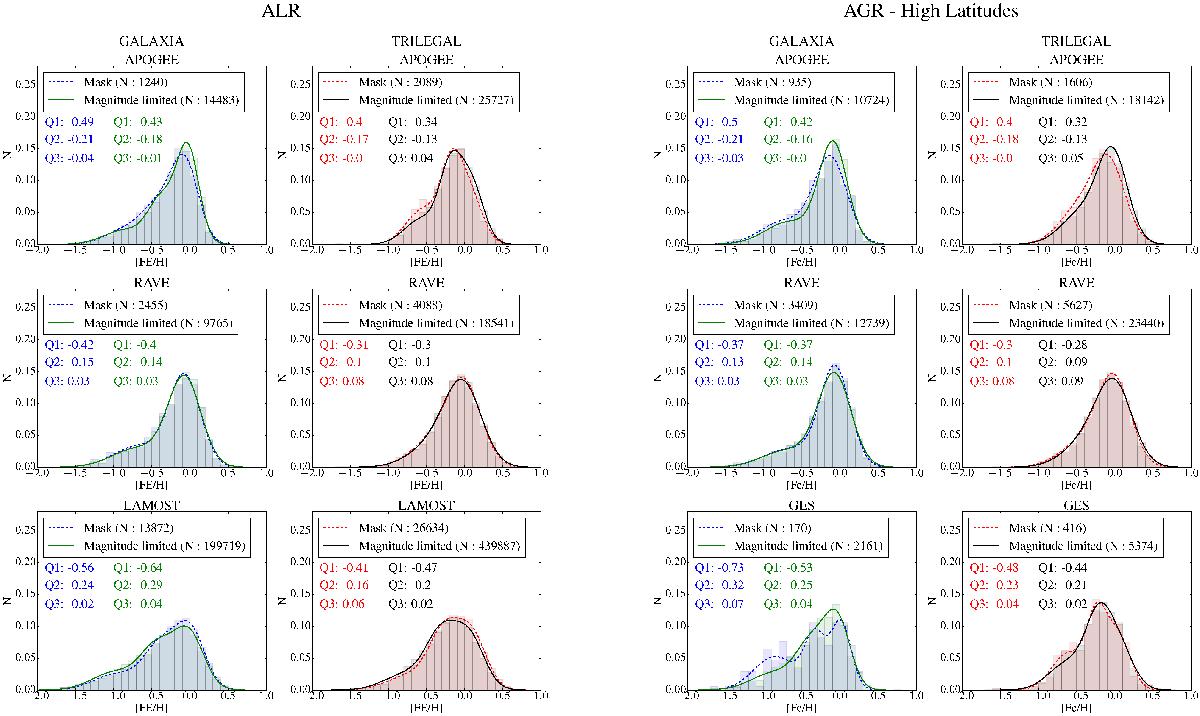
MDFs of magnitude limited and mask sample for the high latitude fields of each survey in ALR (left) and AGR (right). The GALAXIA and TRILEGAL MDFs are shown respectively in the left and right columns of each panel. The histograms are normalized by dividing the counts in each 0.1 dex bin by the total number of sources (mentioned in each panel). The blue and red lines represent the mask distribution, while the green and black lines for the magnitude limited distribution fitted using GMM for GALAXIA and TRILEGAL respectively. APOGEE and RAVE distributions are shown in the top and middle rows, respectively, and the LAMOST (left) and GES (right) in the bottom row. Quartile values for the two distributions are given in each panel, colour-coded according to the distribution.
Current usage metrics show cumulative count of Article Views (full-text article views including HTML views, PDF and ePub downloads, according to the available data) and Abstracts Views on Vision4Press platform.
Data correspond to usage on the plateform after 2015. The current usage metrics is available 48-96 hours after online publication and is updated daily on week days.
Initial download of the metrics may take a while.