Fig. 2
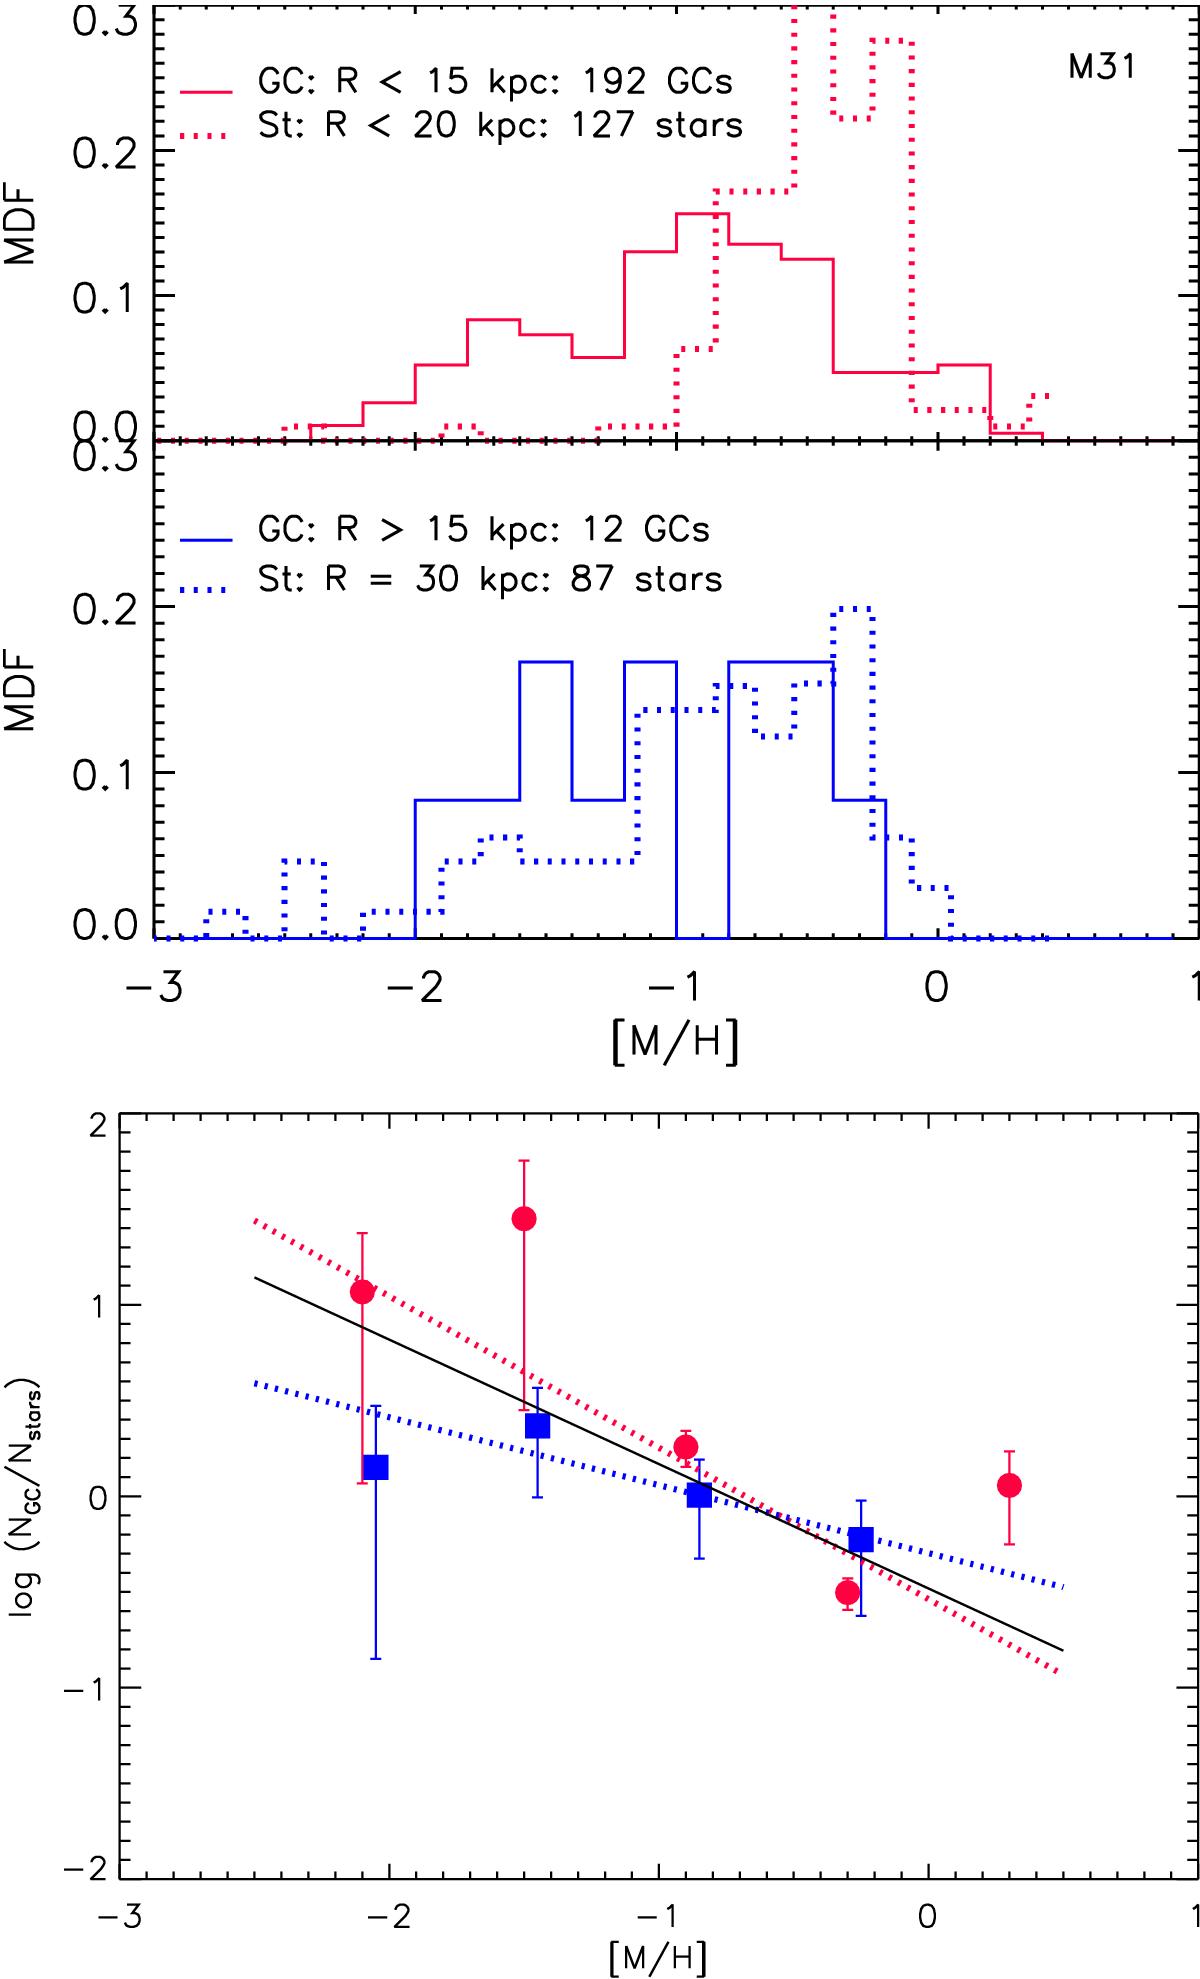
Upper figure: comparison between the normalized MDF of stars (dotted) and GCs (full lines) in two distance regions of M 31. Each MDF is normalized to 1. Lower figure: logarithmic ratio between the normalized MDFs of clusters and stars as a function of [M/H] in bins of 0.6 at two distance regions of M 31. The weighted least square fit of (Ncl/Nstars) versus [M/H] for the inner and outer regions are shown by dotted red and blue lines respectively. The black line is the fit to all data and has a slope of −0.69 ± 0.27.
Current usage metrics show cumulative count of Article Views (full-text article views including HTML views, PDF and ePub downloads, according to the available data) and Abstracts Views on Vision4Press platform.
Data correspond to usage on the plateform after 2015. The current usage metrics is available 48-96 hours after online publication and is updated daily on week days.
Initial download of the metrics may take a while.