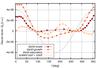
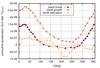
Fig. 9
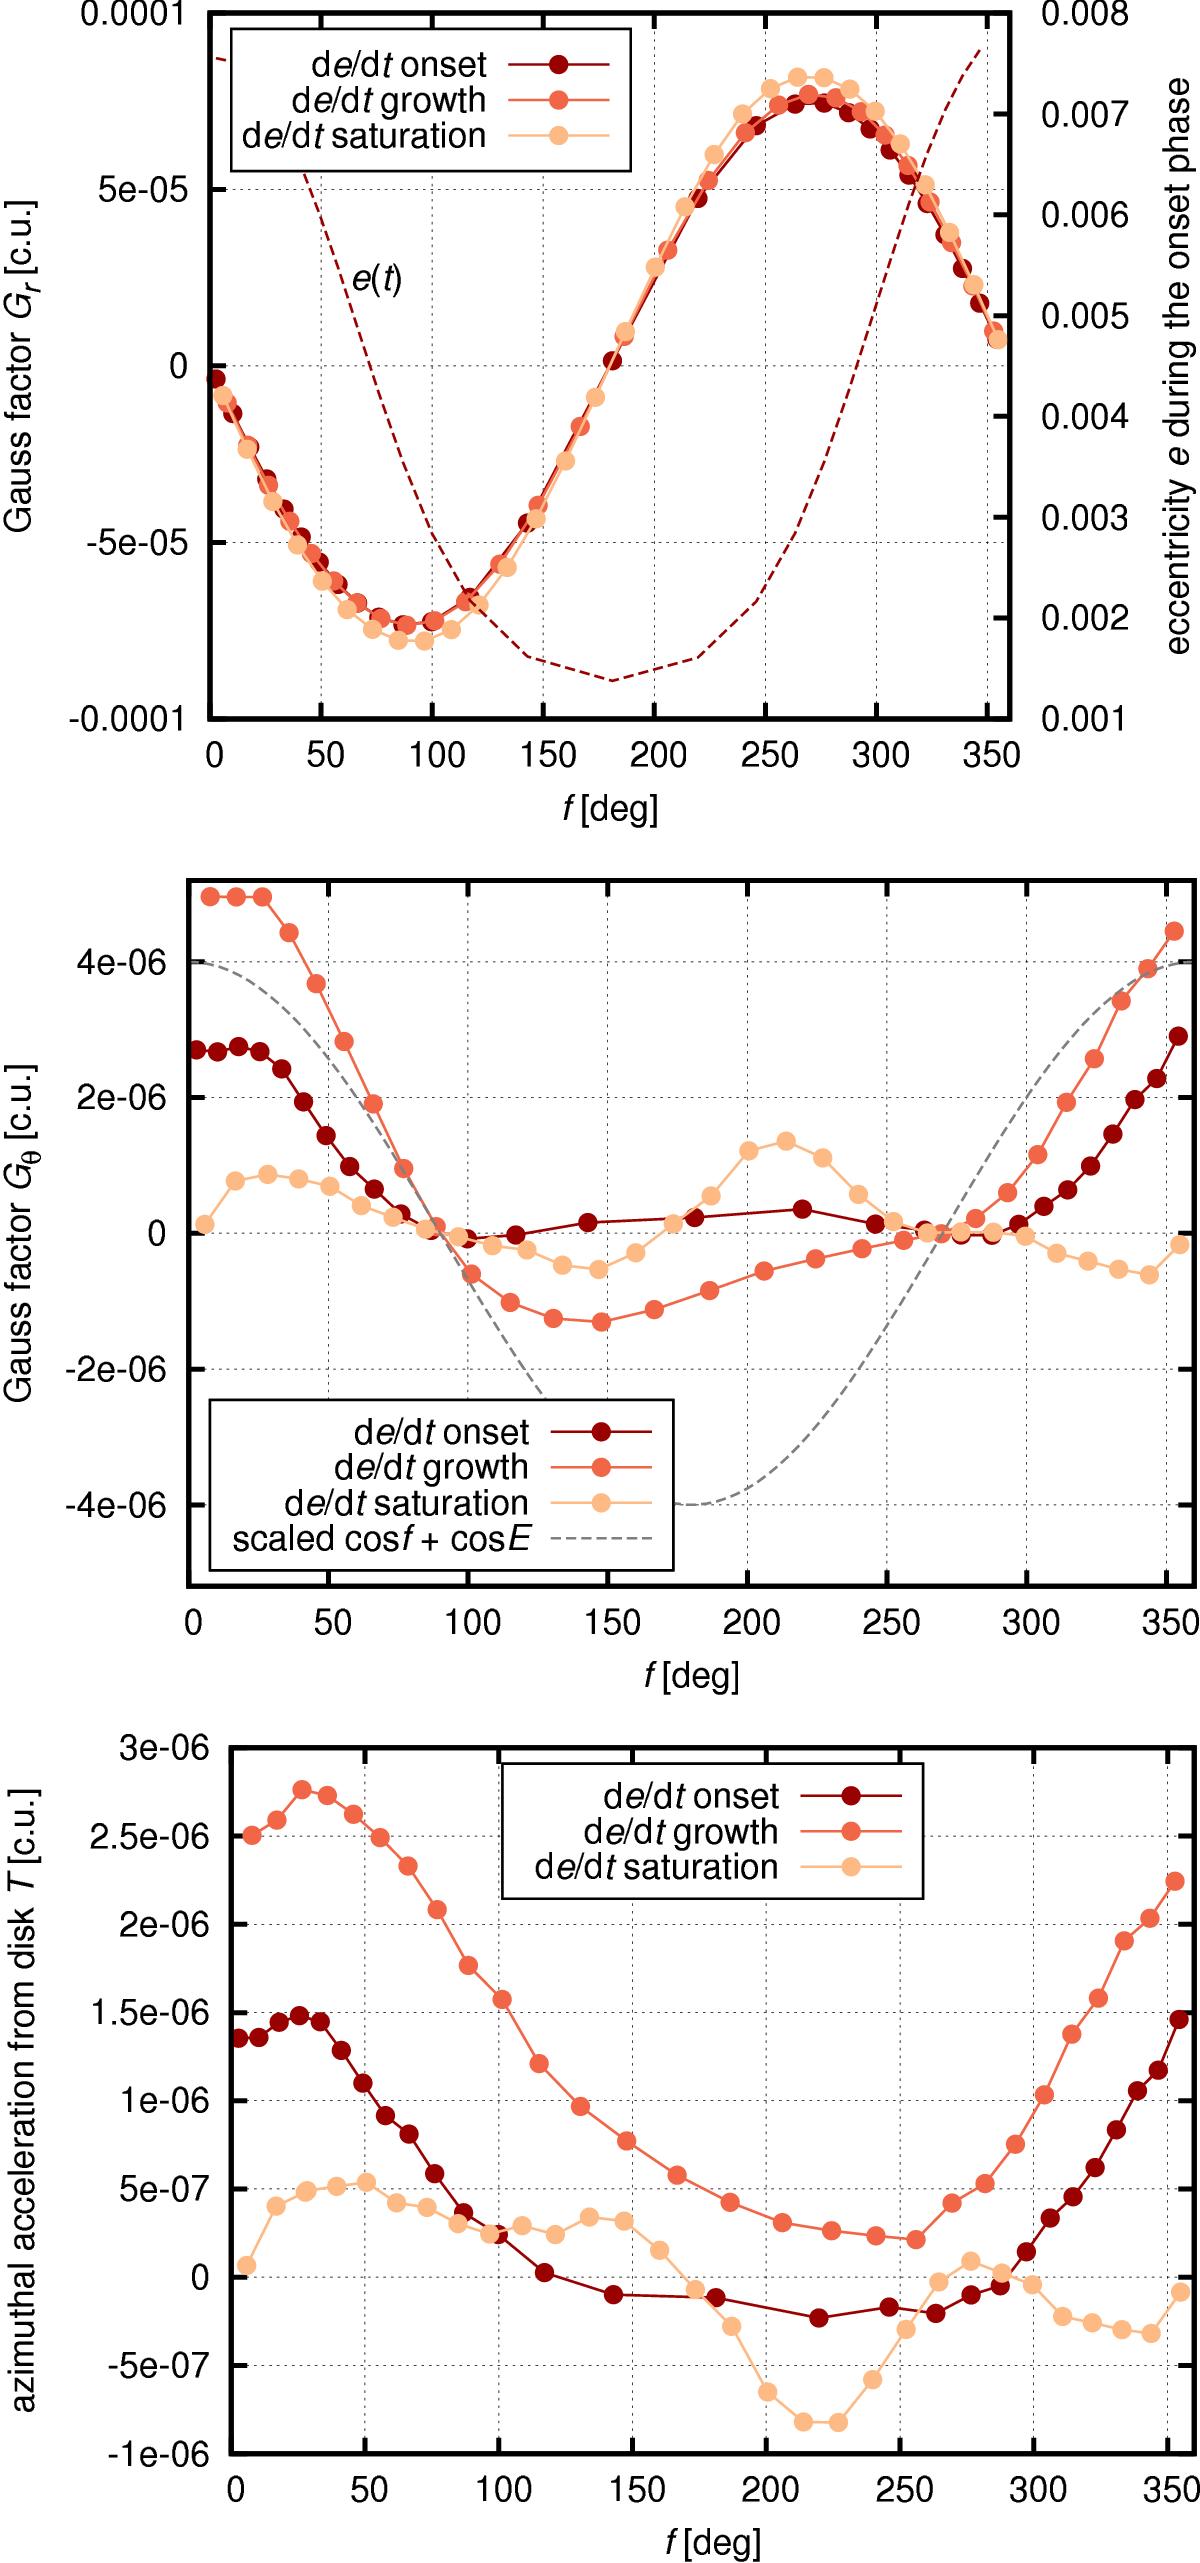
Measures of the gravitational acceleration from the disk acting on the embryo, evolving from initially circular orbit in the presence of pebble accretion and the heating torque (i.e. red curve in Fig. 8). The values are recorded during one orbital period (represented by the true anomaly f), at around t ≃ 180, 360 and 1130 yr of the simulation, that is, during the onset, growth, and saturation phase of the eccentricity excitation. Top: evolution of the Gauss factor Gr ≡ ℛsinf (left vertical axis) and the osculating eccentricity e, which was recorded during the onset phase (right vertical axis). Middle: evolution of the Gauss factor ![]() . The function (cosf + cosE) for e = 0.005 scaled to the axis range is also given for reference (grey dashed curve). Bottom: the azimuthal acceleration
. The function (cosf + cosE) for e = 0.005 scaled to the axis range is also given for reference (grey dashed curve). Bottom: the azimuthal acceleration ![]() from the disk.
from the disk.
Current usage metrics show cumulative count of Article Views (full-text article views including HTML views, PDF and ePub downloads, according to the available data) and Abstracts Views on Vision4Press platform.
Data correspond to usage on the plateform after 2015. The current usage metrics is available 48-96 hours after online publication and is updated daily on week days.
Initial download of the metrics may take a while.