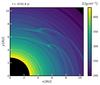
Fig. 7
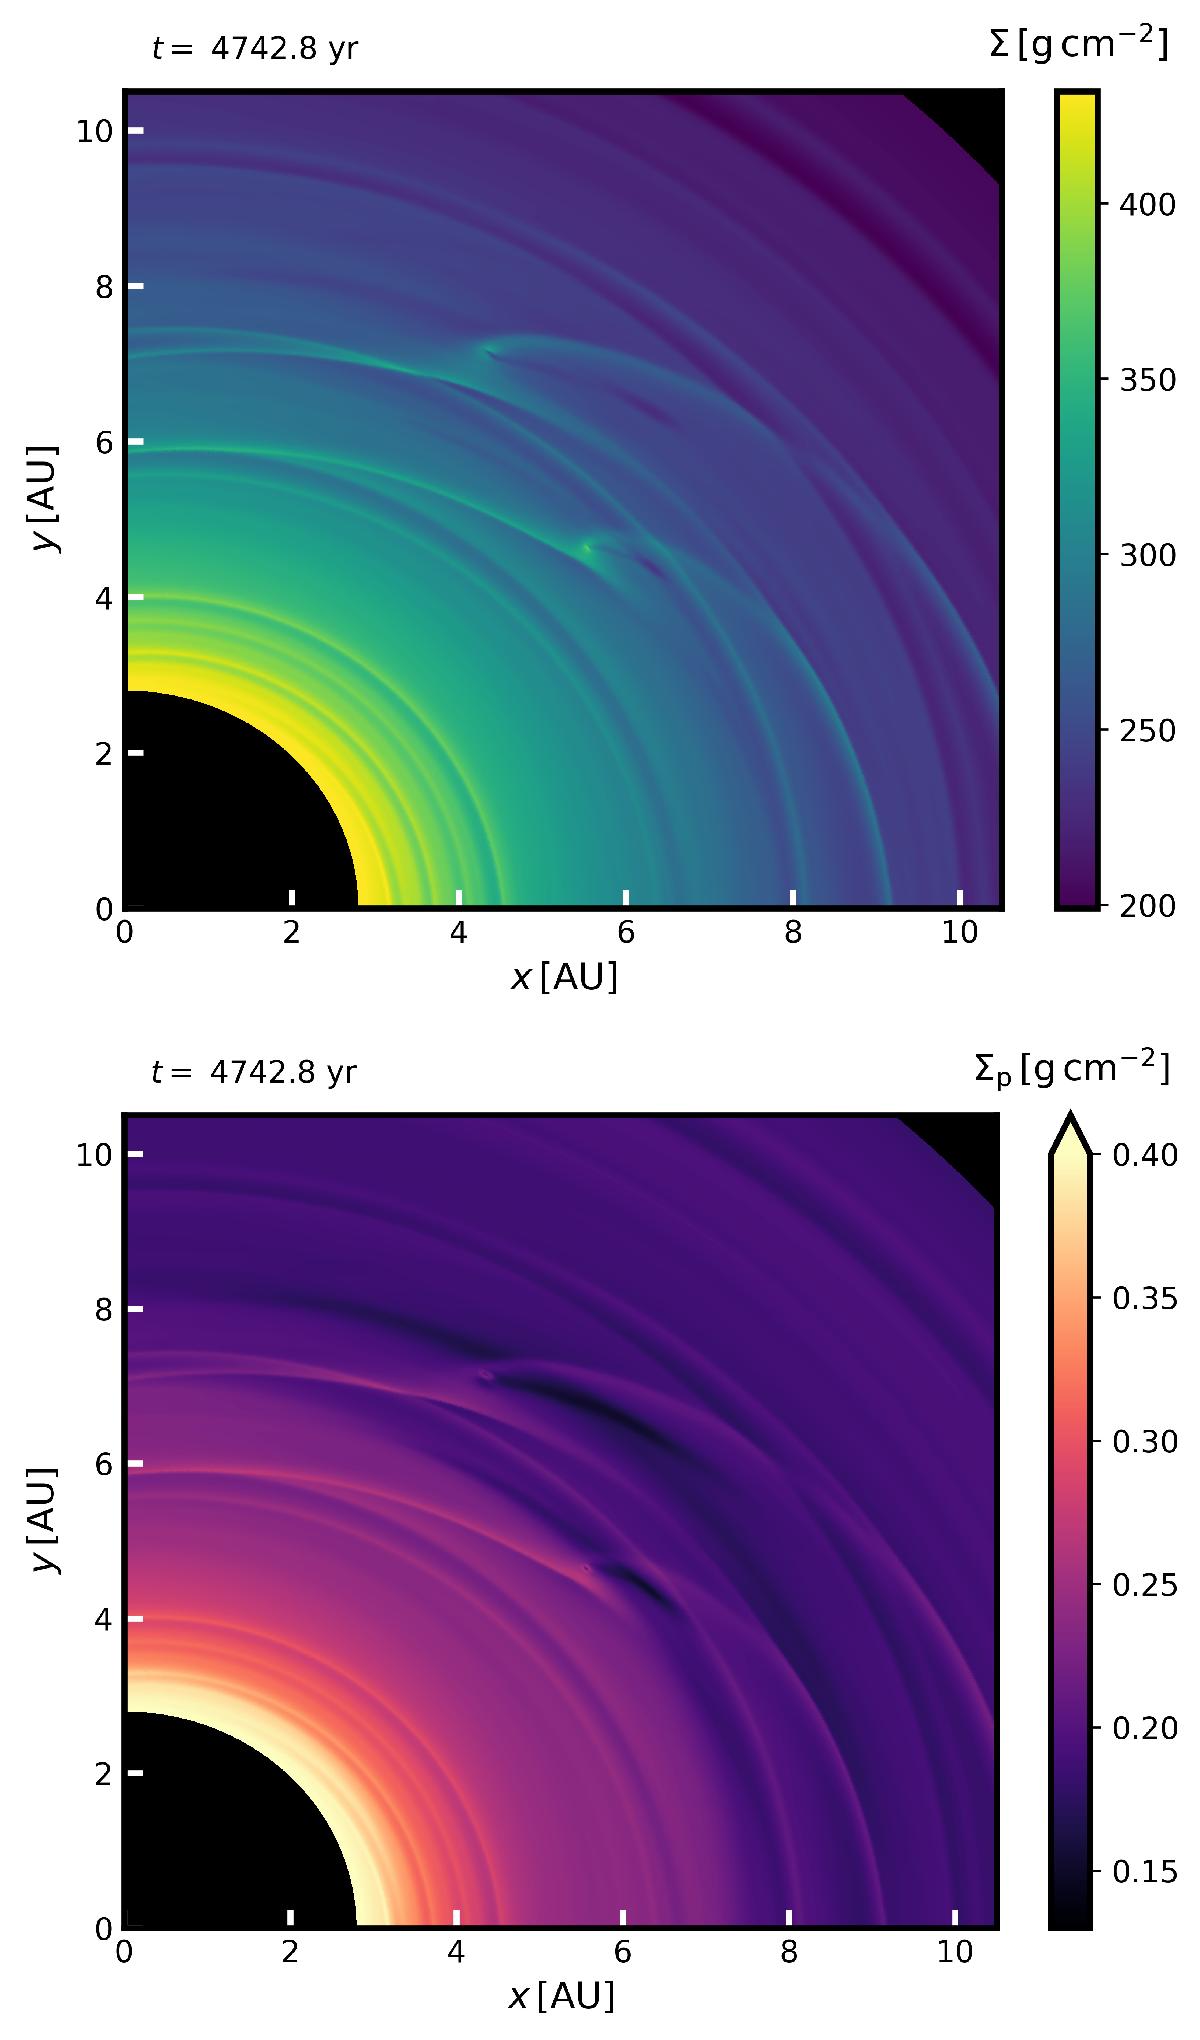
Same as Fig. 6 but for the simulation with accretion heating (Case III). Two embryos are located at x = 5.55,y = 4.65 AU and x = 4.35,y = 7.17 AU; two other embryos are located outside the range. The Σ distribution shows that there are trails of underdense gas stretching outwards from the embryos, trailing their orbital motion. The shape of cavities in the pebble component is affected by the eccentric orbits of embryos. Unlike in Fig. 6, the concentration peak at the embryos’ location is somewhat blurred in both gas and pebbles.
Current usage metrics show cumulative count of Article Views (full-text article views including HTML views, PDF and ePub downloads, according to the available data) and Abstracts Views on Vision4Press platform.
Data correspond to usage on the plateform after 2015. The current usage metrics is available 48-96 hours after online publication and is updated daily on week days.
Initial download of the metrics may take a while.