Free Access
Fig. D.4
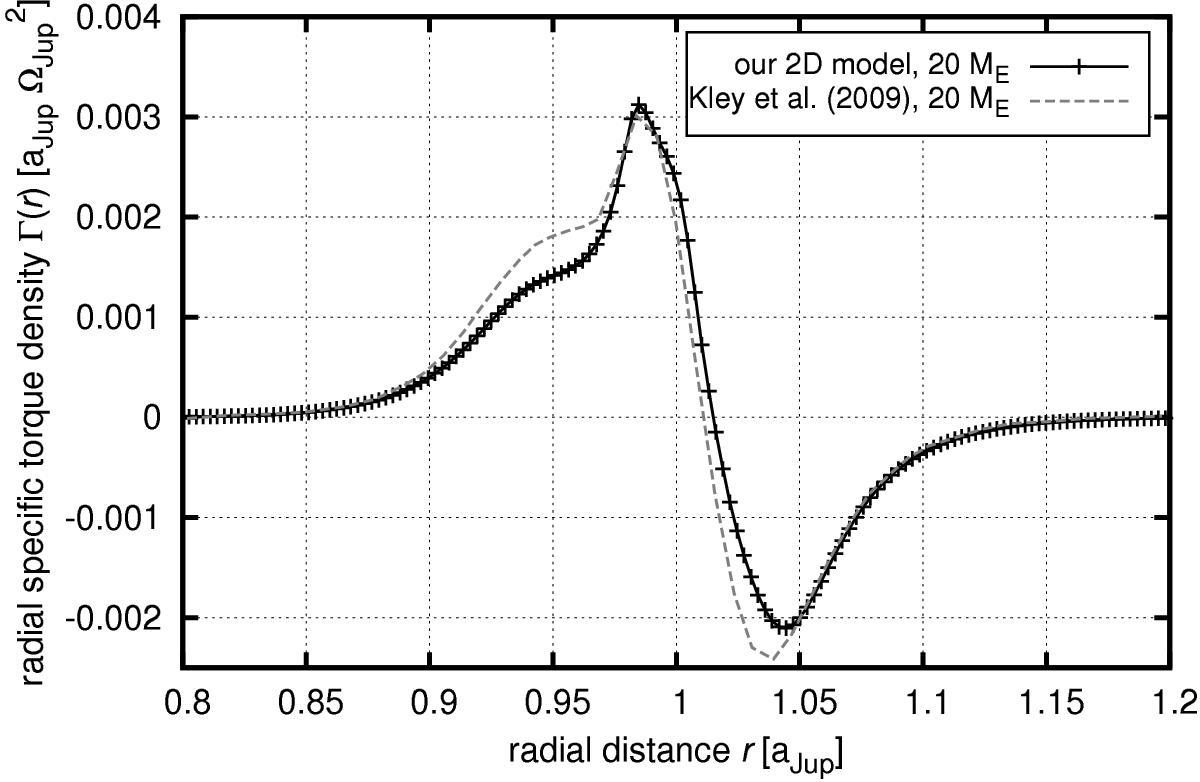
Radial density of the specific torque Γ(r) acting on a 20 ME embryo as calculated by our code (black curve). The comparative profile from the original 3D experiment of Kley et al. (2009) is represented by the grey dashed line. Again, the agreement is very good.
Current usage metrics show cumulative count of Article Views (full-text article views including HTML views, PDF and ePub downloads, according to the available data) and Abstracts Views on Vision4Press platform.
Data correspond to usage on the plateform after 2015. The current usage metrics is available 48-96 hours after online publication and is updated daily on week days.
Initial download of the metrics may take a while.