Fig. D.3
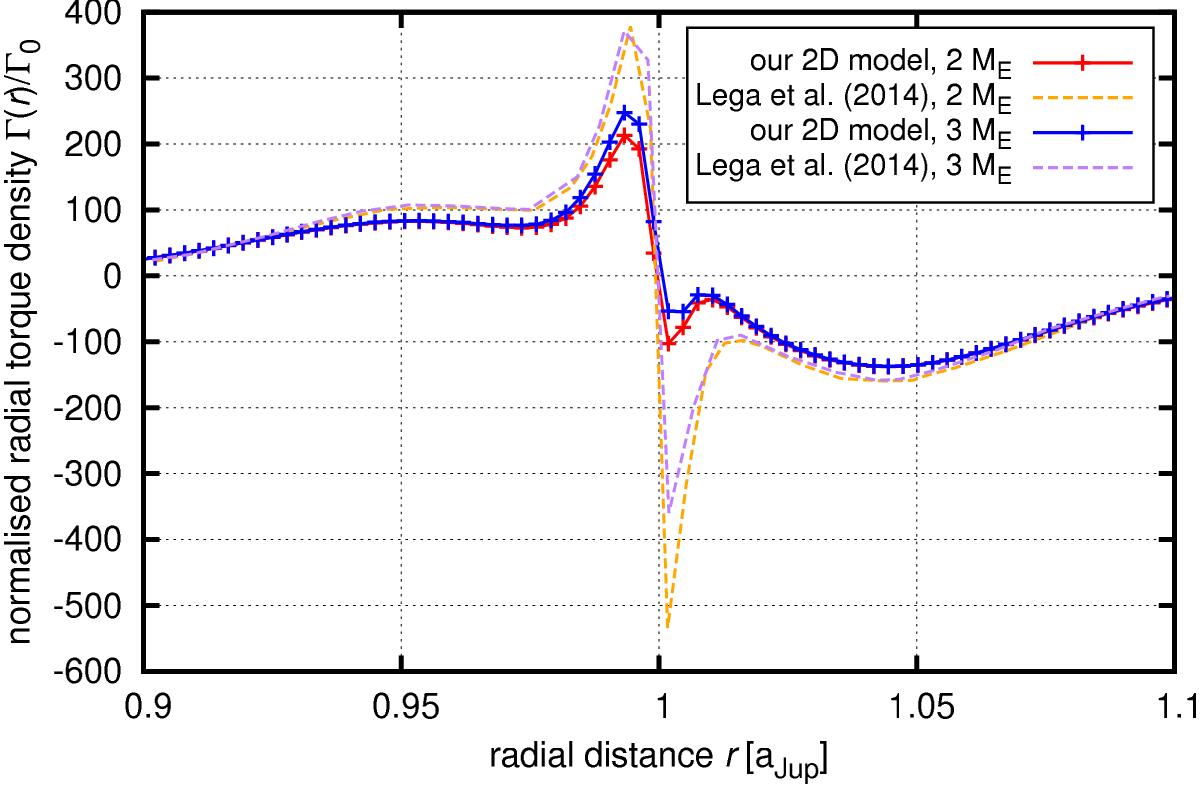
Normalised radial torque density Γ(r) / Γ0 acting on 2 ME and 3 ME embryos as obtained by our code (red and blue curve, respectively). Results of the original 3D experiment from Lega et al. (2014) are given for comparison (orange dashed curve for 2 ME and purple dashed curve for 3 ME). As the cold finger structure is not entirely reproduced by our code, the torque density peaks are less pronounced. However, the overall torque (i.e. the integral of Γ(r) over r) is still in very good agreement with the 3D model (cf. Fig. D.2).
Current usage metrics show cumulative count of Article Views (full-text article views including HTML views, PDF and ePub downloads, according to the available data) and Abstracts Views on Vision4Press platform.
Data correspond to usage on the plateform after 2015. The current usage metrics is available 48-96 hours after online publication and is updated daily on week days.
Initial download of the metrics may take a while.