Fig. D.2
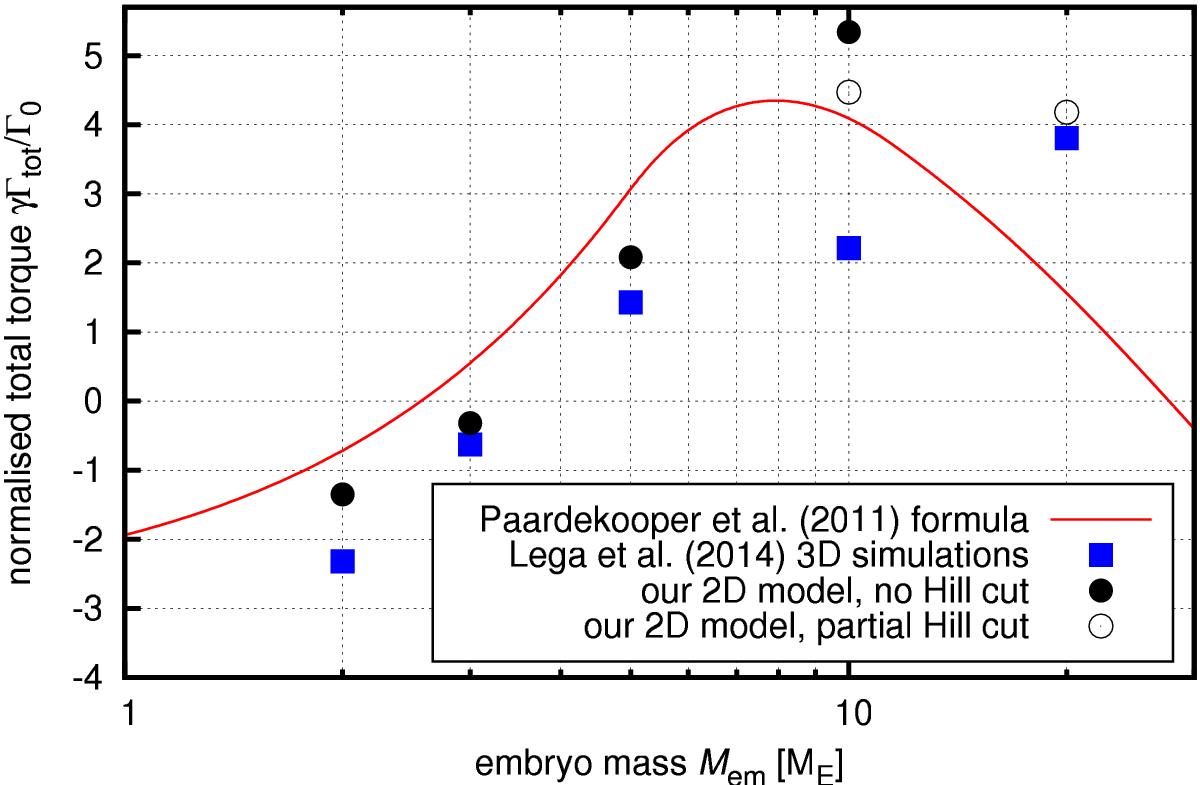
A comparison of the normalised total torque γΓtot/ Γ0 acting on embryos of various masses Mem, moving on fixed circular orbits in the disk shown in Fig. D.1. The results achieved with our code are shown by black circles, or open circles if the Hill cut was applied. Values obtained by 3D calculations of Lega et al. (2014) are represented by blue squares. Formula from Paardekooper et al. (2011) applied to the equilibrium disk profile (with the potential smoothing parameter ϵ = 0.4) is given by the red curve. We consider the differences between our model and the comparison simulations to be acceptable.
Current usage metrics show cumulative count of Article Views (full-text article views including HTML views, PDF and ePub downloads, according to the available data) and Abstracts Views on Vision4Press platform.
Data correspond to usage on the plateform after 2015. The current usage metrics is available 48-96 hours after online publication and is updated daily on week days.
Initial download of the metrics may take a while.