Fig. D.1
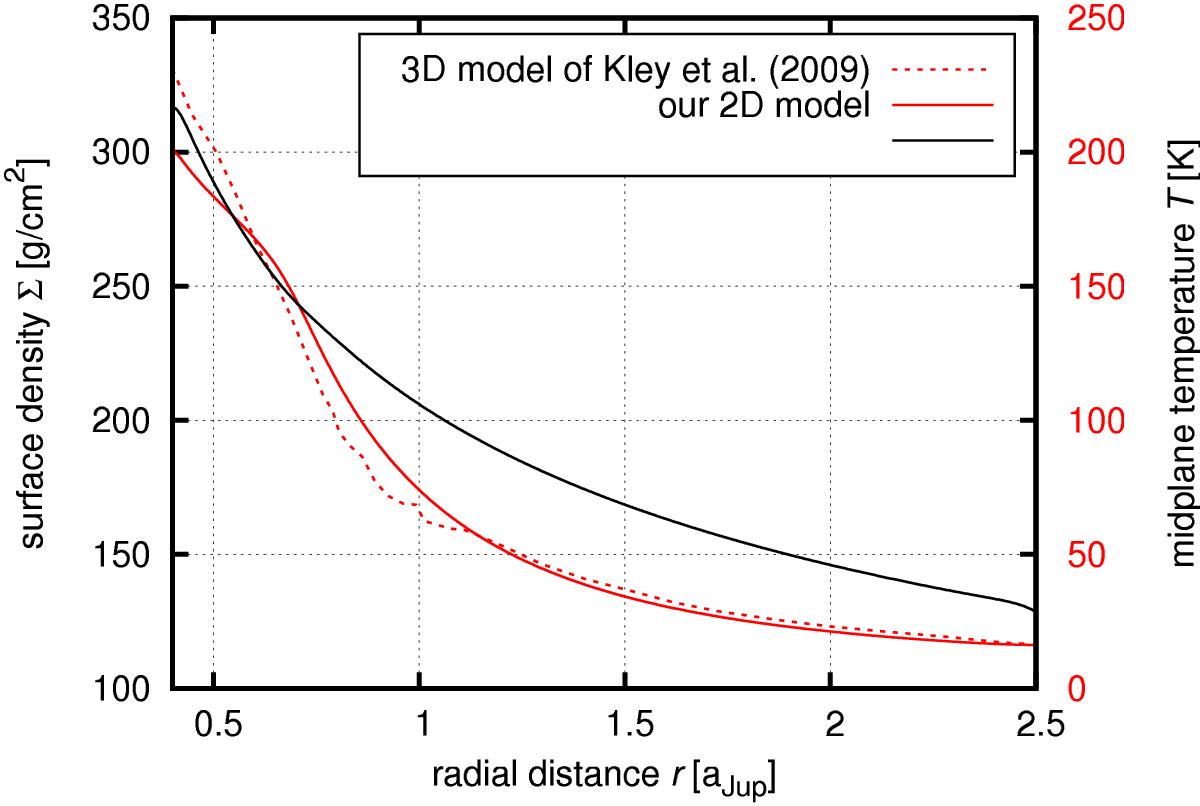
Equilibrium gas surface density Σ(r) (black curve, left vertical axis) and temperature T(r) profile (red curve, right vertical axis) in a radiative disk according to the setup from Kley et al. (2009), as it was reproduced by our code. Temperature profile obtained by the original 3D model of Kley et al. (2009) is given by the red dashed curve for comparison. The obtained disk is indeed in good agreement with the comparison simulation and serves as the hydrodynamic background for verification runs of the disk-embryo interaction.
Current usage metrics show cumulative count of Article Views (full-text article views including HTML views, PDF and ePub downloads, according to the available data) and Abstracts Views on Vision4Press platform.
Data correspond to usage on the plateform after 2015. The current usage metrics is available 48-96 hours after online publication and is updated daily on week days.
Initial download of the metrics may take a while.