Fig. 12
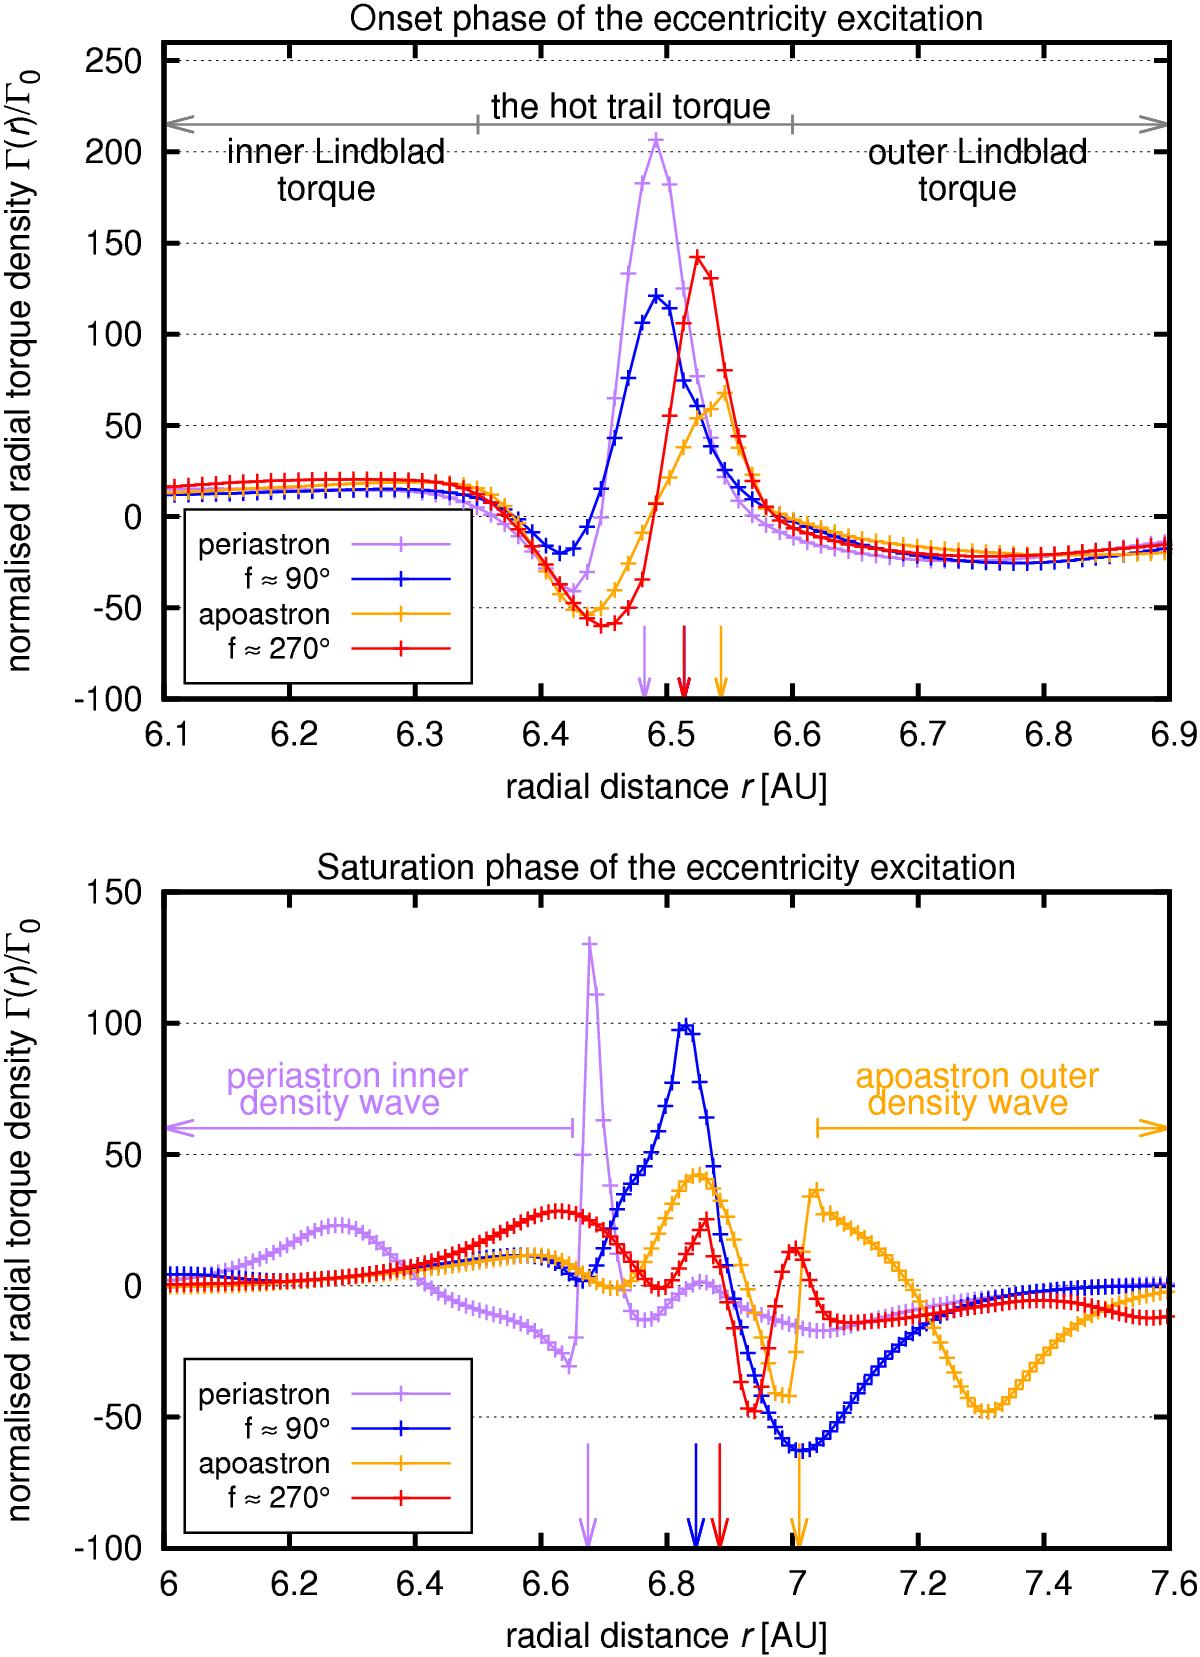
Radial torque density Γ(r) acting on the embryo during the onset (top) and saturation (bottom) phases, normalised to Γ0. The individual curves represent measurements in the periastron (purple), apoastron (orange) and in-between. The vertical arrows indicate the instantaneous radial distance of the embryo corresponding to the individual curves. The horizontal arrows and labels approximately distinguish some of the important torque contributions discussed in the text. To avoid misinterpretation, we remark that the hot-trail torque is acting in the bottom panel as well but it spans different radial extent for each curve and thus cannot be marked unambiguously.
Current usage metrics show cumulative count of Article Views (full-text article views including HTML views, PDF and ePub downloads, according to the available data) and Abstracts Views on Vision4Press platform.
Data correspond to usage on the plateform after 2015. The current usage metrics is available 48-96 hours after online publication and is updated daily on week days.
Initial download of the metrics may take a while.