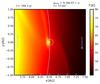
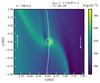
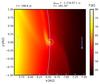
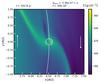
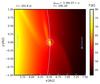
Fig. 10
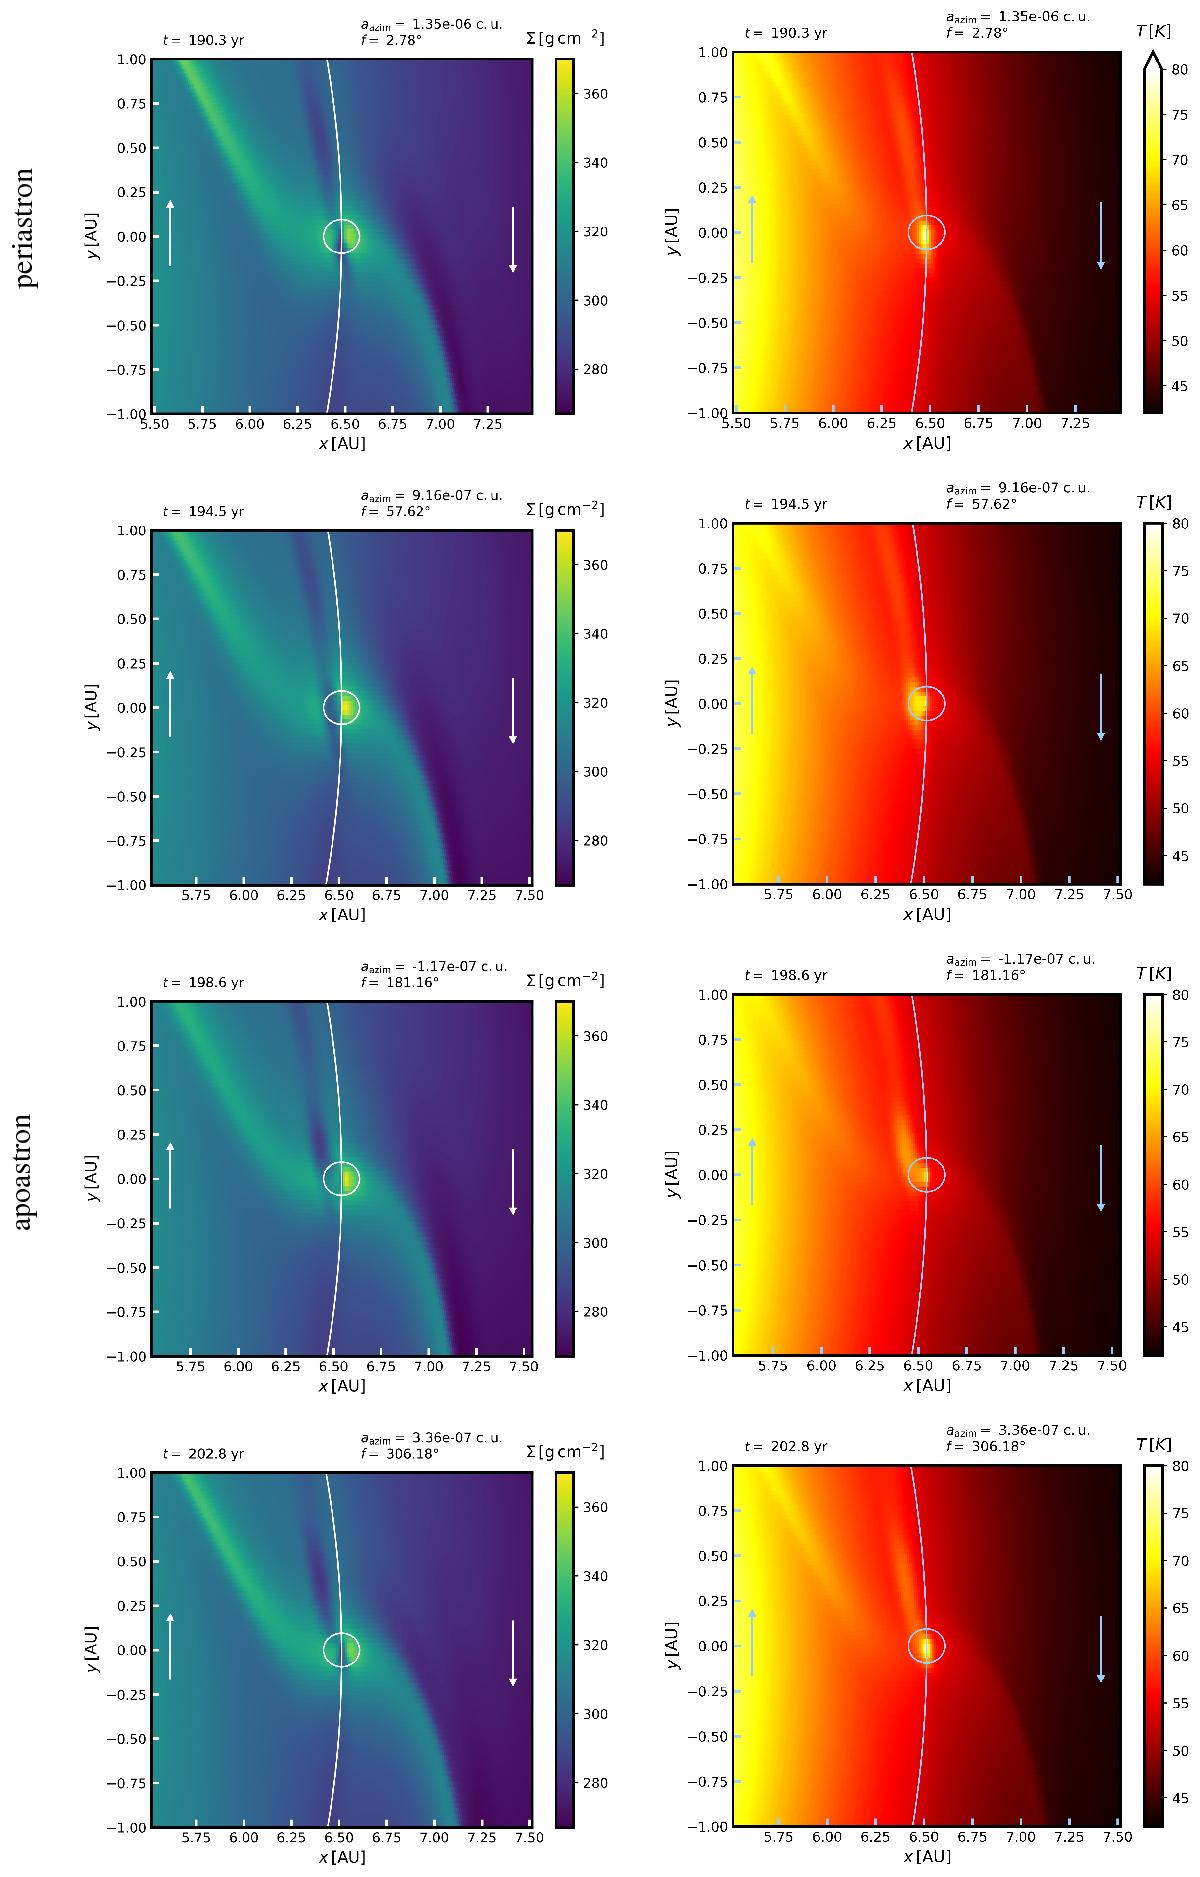
Evolution of the gas surface density Σ (left column) and temperature T (right column) during one orbital period, recorded within the onset phase of the eccentricity growth. Individual snapshots are labelled with the respective simulation time t, embryo’s true anomaly f and azimuthal acceleration imposed by the disk, labelled here aazim. The figures are transformed to the corotating frame centered on the embryo. The Hill sphere and embryo’s osculating orbit are plotted and we also indicate general directions of the gas flow with respect to the embryo by arrows. The orbital direction of the embryo is directed counterclockwise and the protostar is located at (x = 0,y = 0). The top row depicts the situation in the periastron, while the third row corresponds to the apoastron. The second row is recorded approximately halfway from periastron to apoastron, and vice versa for the bottom row.
Current usage metrics show cumulative count of Article Views (full-text article views including HTML views, PDF and ePub downloads, according to the available data) and Abstracts Views on Vision4Press platform.
Data correspond to usage on the plateform after 2015. The current usage metrics is available 48-96 hours after online publication and is updated daily on week days.
Initial download of the metrics may take a while.