Fig. 1
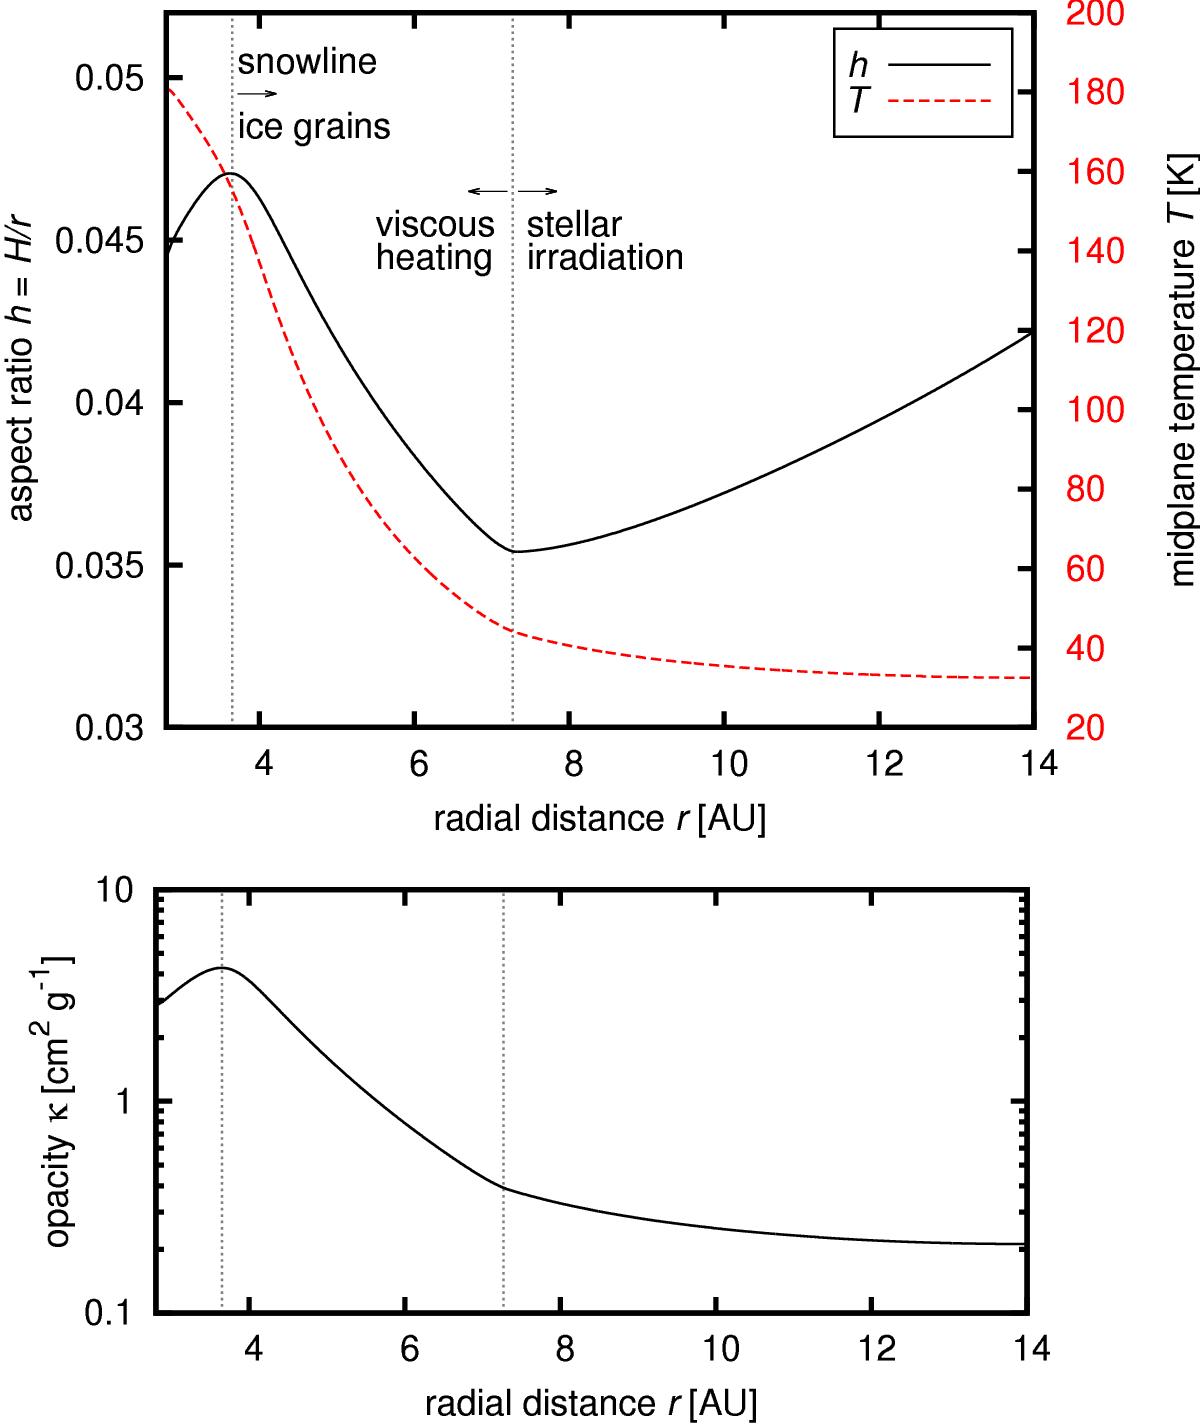
Top: radial profile of the aspect ratio h = H/r (black curve, left vertical axis) and midplane temperature T (red dashed curve, right vertical axis) in our disk model. Bottom: radial profile of the opacity κ. The plots show the state reached after a relaxation, with all the heating and cooling terms in balance. This is considered an equilibrium state prior to the follow-up simulations with embedded embryos. Vertical dotted lines indicate important changes in the disk structure, namely the snowline close to r ≃ 4 AU and the transition to the flared stellar-irradiated outer region near r ≃ 7 AU.
Current usage metrics show cumulative count of Article Views (full-text article views including HTML views, PDF and ePub downloads, according to the available data) and Abstracts Views on Vision4Press platform.
Data correspond to usage on the plateform after 2015. The current usage metrics is available 48-96 hours after online publication and is updated daily on week days.
Initial download of the metrics may take a while.