Fig. 7
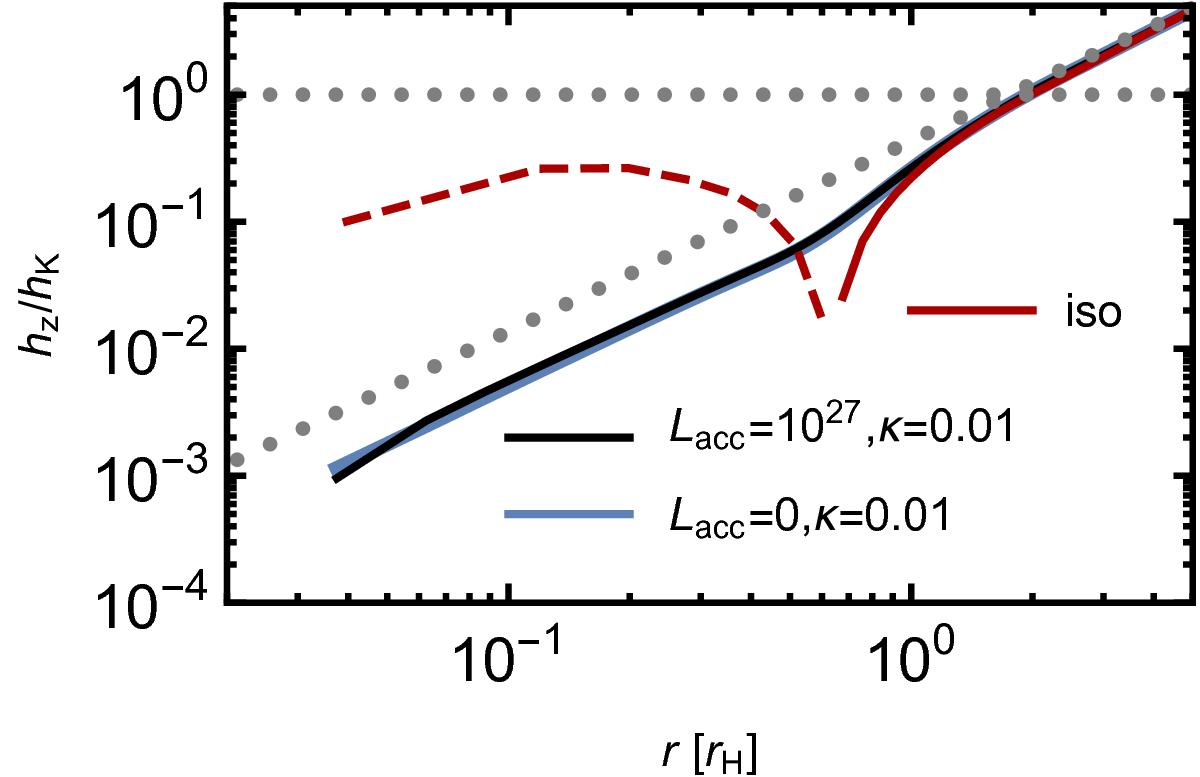
Azimuthally averaged specific angular momentum, normalized by the Keplerian value, measured in the midplane. Full lines indicate retrograde motion, while dashed lines mark prograde motion. The red curve shows an isothermal simulation (run ISO) with prograde rotation inside the Hill sphere. The black and blue curve correspond to, respectively, the reference simulations RADL27k0.01 and RADL0k0.01. Gray dotted lines indicate two limit cases, gas purely in Keplerian rotation around the core (hz/hK = 1) and gas in purely Keplerian rotation around the star, as if no planet were present (Eq. (22)).
Current usage metrics show cumulative count of Article Views (full-text article views including HTML views, PDF and ePub downloads, according to the available data) and Abstracts Views on Vision4Press platform.
Data correspond to usage on the plateform after 2015. The current usage metrics is available 48-96 hours after online publication and is updated daily on week days.
Initial download of the metrics may take a while.