Fig. 5
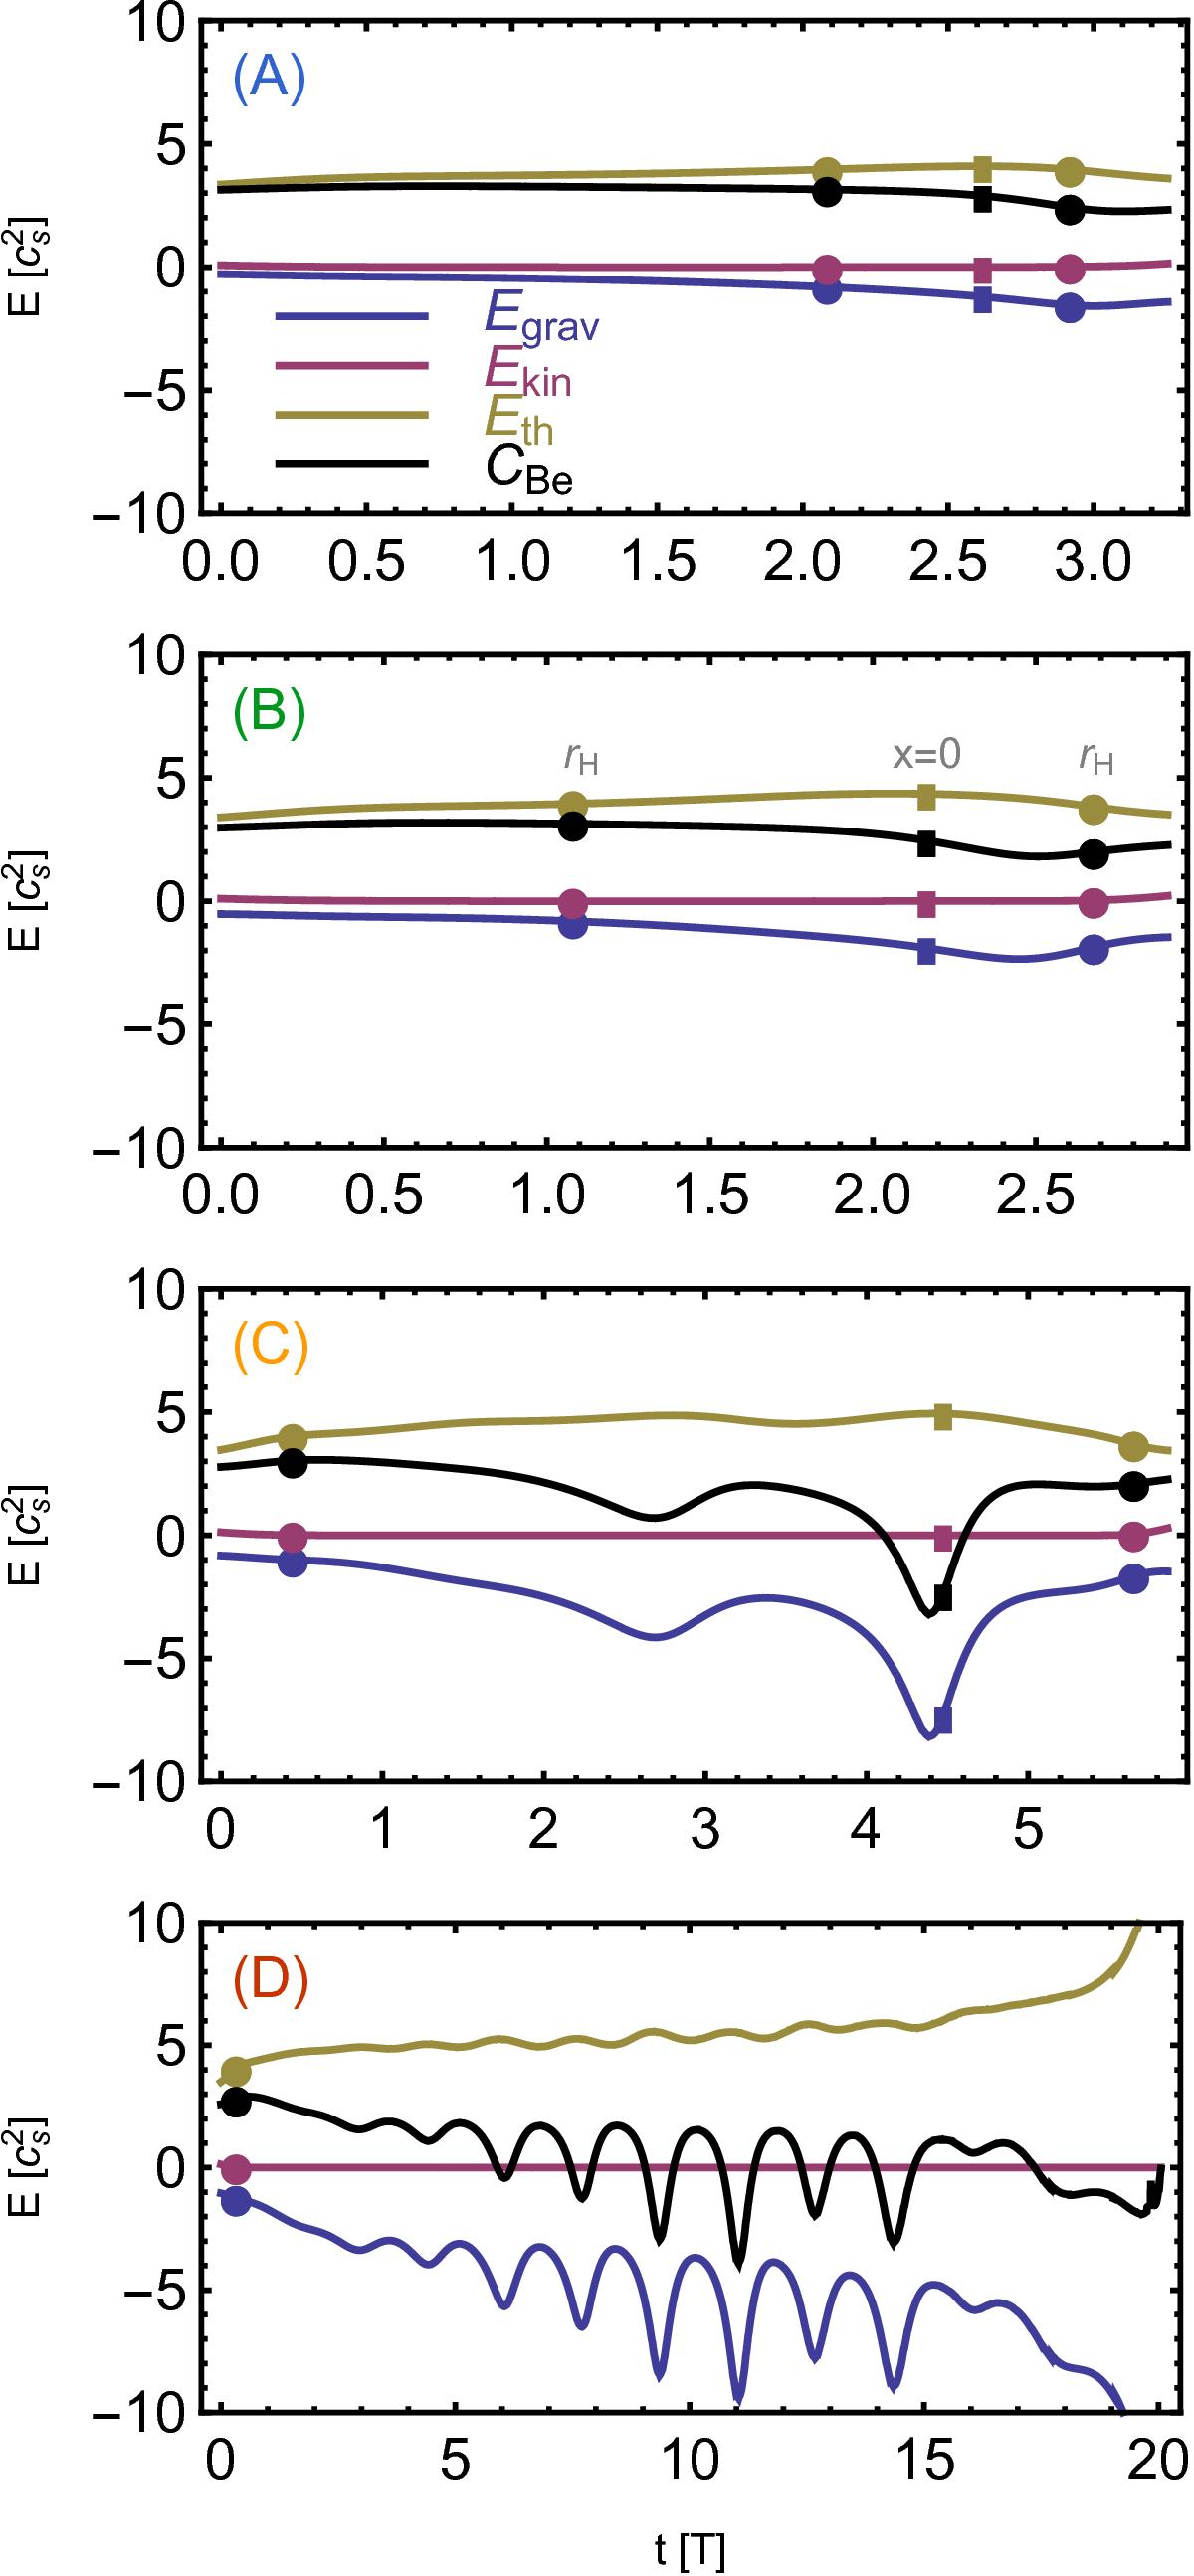
Energy balance along streamlines as a function of time in units of orbital period T. Each panel traces the energy budget for the different streamlines depicted in Fig. 4, with panels A to D decreasing in height above the midplane. Magenta curves show the kinetic energy contribution, which is negligible. The purple curve is the effective potential term (see main text for full description). The green curve gives the thermal energy along the streamline. The black curve is the sum of the energy contributions, the Bernoulli parameter. Circles mark the points where the field line enters and exits the Hill sphere. The square symbol indicates the point where the fluid parcel crosses the x = 0 plane, which corresponds to the orbit of the planet. When multiple crossings occur the point closest to the core is selected.
Current usage metrics show cumulative count of Article Views (full-text article views including HTML views, PDF and ePub downloads, according to the available data) and Abstracts Views on Vision4Press platform.
Data correspond to usage on the plateform after 2015. The current usage metrics is available 48-96 hours after online publication and is updated daily on week days.
Initial download of the metrics may take a while.