Fig. 8
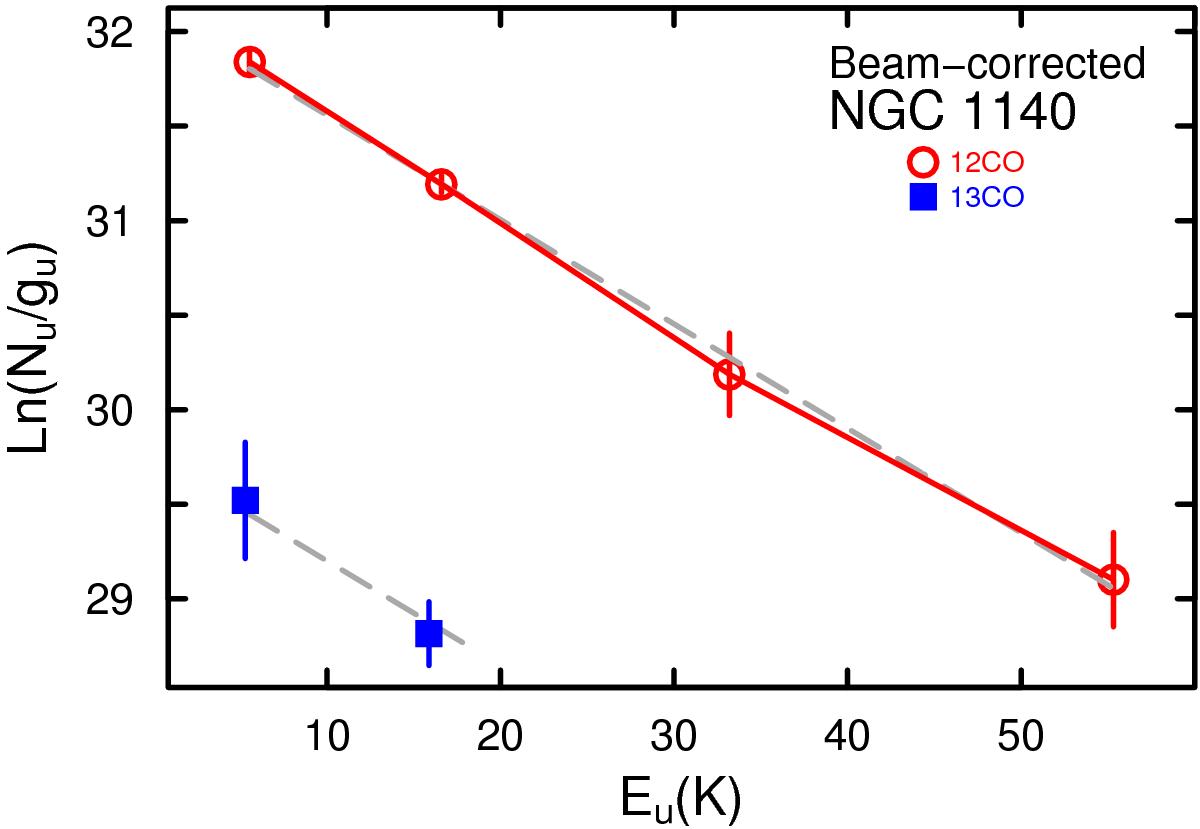
Rotation or population level diagram for NGC 1140. A beam correction has been applied to the integrated intensities (see Sect. 4 for more details). Both 12CO and 13CO transitions are shown, as indicated by open (red) circles and filled (blue) squares, respectively. The gray dashed line for 12CO corresponds to the best-fit regressions; the temperature for 13CO is ill determined with only two transitions, so we fixed it to the 12CO value of Tex = 18.1 K.
Current usage metrics show cumulative count of Article Views (full-text article views including HTML views, PDF and ePub downloads, according to the available data) and Abstracts Views on Vision4Press platform.
Data correspond to usage on the plateform after 2015. The current usage metrics is available 48-96 hours after online publication and is updated daily on week days.
Initial download of the metrics may take a while.