Fig. 3
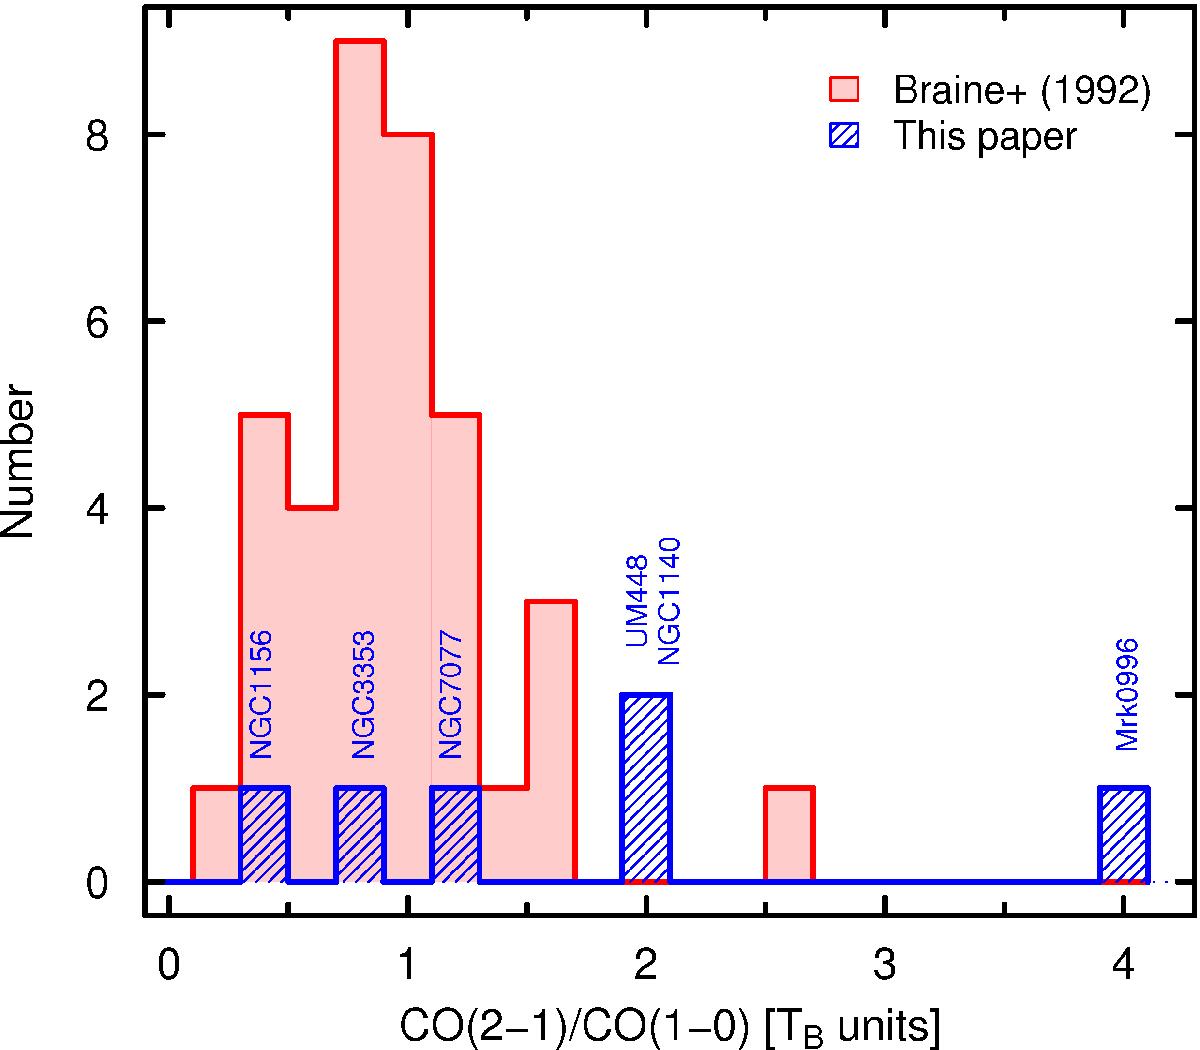
Histogram of observed 12CO(2–1)/12CO(1–0) line ratios for our targets corrected for beam dilution as described in Sect. 4. Because of the larger beam, for Mrk 996 and UM 448, we show the APEX 12CO(2–1) measurements rather than the ones from IRAM. Also plotted are the line ratios corrected for beam dilution of a large sample of spiral galaxies observed by Braine & Combes (1992).
Current usage metrics show cumulative count of Article Views (full-text article views including HTML views, PDF and ePub downloads, according to the available data) and Abstracts Views on Vision4Press platform.
Data correspond to usage on the plateform after 2015. The current usage metrics is available 48-96 hours after online publication and is updated daily on week days.
Initial download of the metrics may take a while.