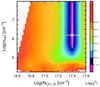
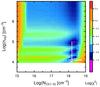
Fig. 14

RADEX fit of the χ2 (logarithmic) surface of the [Ci]/12CO fits as a function of nH2 and NCI(1−0); the left panel shows the intensity fits (Eq. (4)) and the right the ratio ones (Eq. (5)). The RADEX models shown here have ΔV = 20 km s-1. The associated Log(χ2) values are shown as a side-bar color table. The best-fit values are shown as an open (white) circle; the error bars shown consider a slightly more limited range in χ2 respect to Table 6.
Current usage metrics show cumulative count of Article Views (full-text article views including HTML views, PDF and ePub downloads, according to the available data) and Abstracts Views on Vision4Press platform.
Data correspond to usage on the plateform after 2015. The current usage metrics is available 48-96 hours after online publication and is updated daily on week days.
Initial download of the metrics may take a while.