Fig. 3
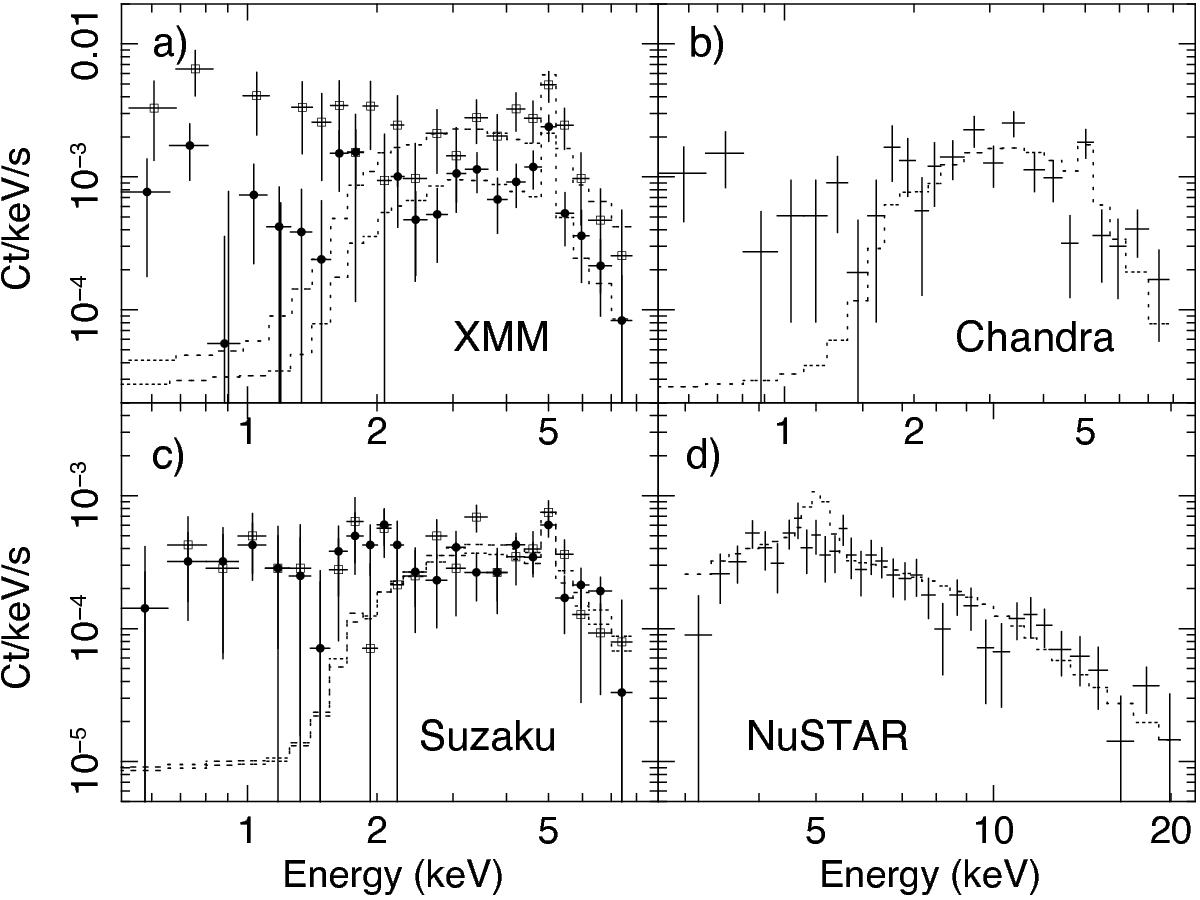
Energy spectra of IRAS F00183–7111, observed with four X-ray observatories: a) XMM-Newton: EPIC pn (open squares) and EPIC MOS1 and MOS2 combined (solid circles); b) Chandra ACIS-S; c) Suzaku XIS0 (solid circles); XIS1 and XIS3 combined (open squares); and d) NuSTAR: FPMA and FPMB combined. The dotted-line histogram in each panel indicates the best-fit model of an absorbed power-law plus a Gaussian for the 2–20 keV data obtained by fitting to all the datasets jointly (see text). Spectral parameters are identical between the observatories apart from the normalizations of the power-law and the Gaussian line. Emission below 2 keV originates from an extended extranuclear region (Fig. 1). Note that the model for Fe K in (d) shows a line feature with its intensity observed with XMM-Newton for a comparison with the data.
Current usage metrics show cumulative count of Article Views (full-text article views including HTML views, PDF and ePub downloads, according to the available data) and Abstracts Views on Vision4Press platform.
Data correspond to usage on the plateform after 2015. The current usage metrics is available 48-96 hours after online publication and is updated daily on week days.
Initial download of the metrics may take a while.