Fig. 8
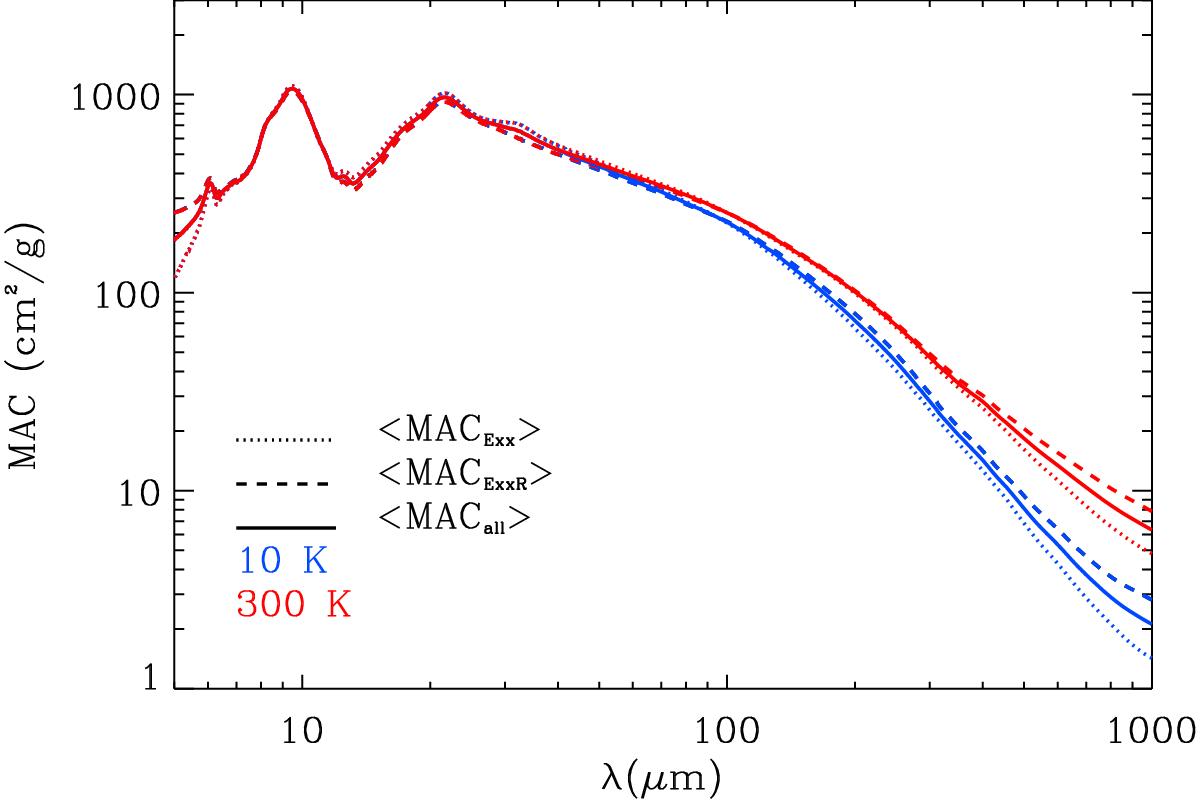
Average MAC of the samples at room temperature (red curve) and at 10 K (blue). The MAC is averaged over the four Exx samples, ⟨MACExx ⟩ (dotted lines); over the four ExxR samples, ⟨MACExxR ⟩ (dashed lines) and over all the samples, ⟨MACall ⟩ (continuous lines).
Current usage metrics show cumulative count of Article Views (full-text article views including HTML views, PDF and ePub downloads, according to the available data) and Abstracts Views on Vision4Press platform.
Data correspond to usage on the plateform after 2015. The current usage metrics is available 48-96 hours after online publication and is updated daily on week days.
Initial download of the metrics may take a while.