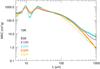
Fig. 7
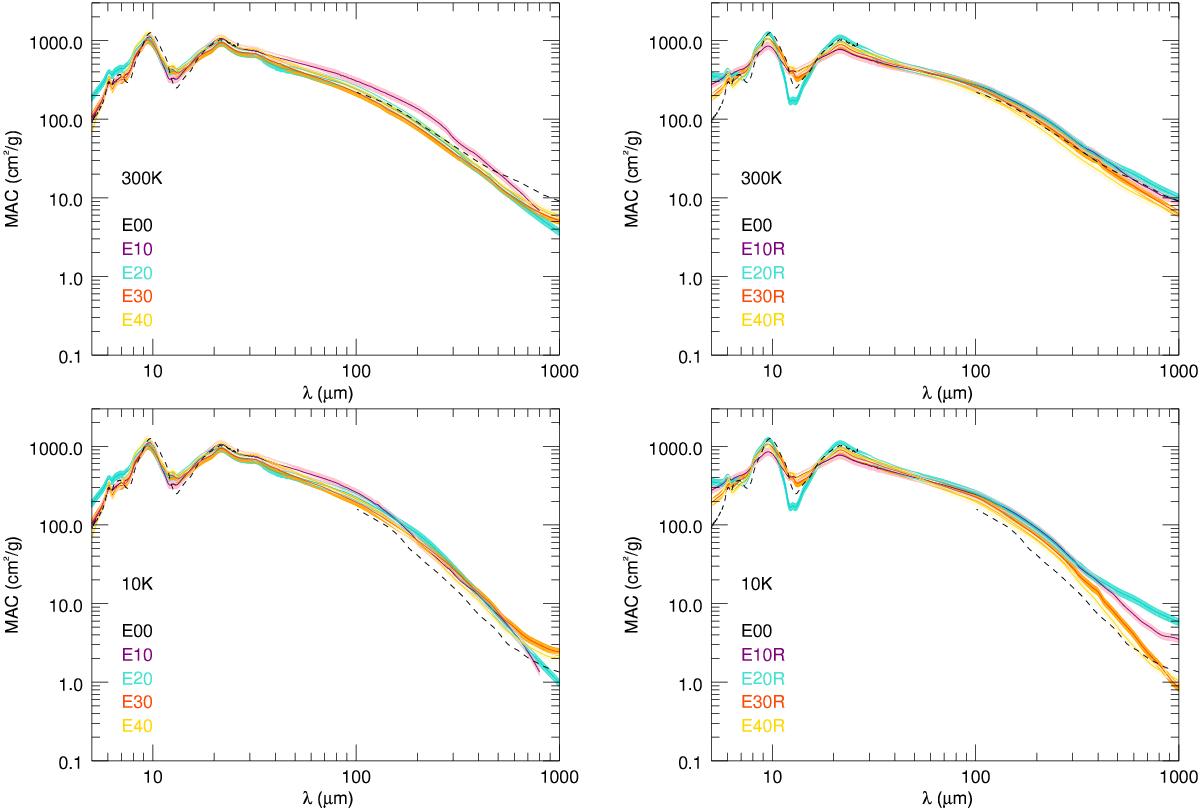
Comparison of the MAC of the samples E10, E20, E30 and E40 (left panels) and of the MAC of the E10R, E20R, E30R and E40R samples (right panels) at 300 K (top panels) and at 10 K (bottom panels). The MAC of the E00 sample is shown as the dotted black line.
This figure is made of several images, please see below:
Current usage metrics show cumulative count of Article Views (full-text article views including HTML views, PDF and ePub downloads, according to the available data) and Abstracts Views on Vision4Press platform.
Data correspond to usage on the plateform after 2015. The current usage metrics is available 48-96 hours after online publication and is updated daily on week days.
Initial download of the metrics may take a while.